Build a Custom Dashboard
Ok nerds, let's do something rad with Helium and build a dashboard for a sensor.
You don't actually have to be a nerd to do this. As long as you can get the hardware listed below, follow directions, and copy/paste, you're going to end up with a working dashboard.
When you're done, this'll be something you can share with your friends to let them know when the rain barrel is full (or if you're Joey's friends, when the sauna is hot)!
I know, I know, you could use a ready-made service like Datacake for public dashbaords, but...we're nerds, and wherever possible we build our own things.
Relax, it won't be super hard. We'll use a few scripts to make installing things secure and easy, so they just "work".
My goal here is to enable a non-technical person to build your own "no-subscription" public or private dashboards for about $200, most of which you'll spend on equipment you'll use in every other IoT project you do.
IoT stuff has been super fun for me to explore, and I'm pumped to share it with you. This is pretty much a love letter to you from me about IoT.
Enjoy!
Get After It
Make sure you have the following on hand:
A. Hardware
1. Core Development Hardware, ~$150 (use this for your next 50 projects)
- Rasbperry Pi 4 with 4 or 8 GB RAM, about $60.
- SD Card for Pi, about $10
- External SSD for the Pi, about $30. IoT data sets can get pretty big and you'll want plenty of space beyond the SD card on the Pi. SD cards can also wear out if you write to 'em a bunch. Something like this is fine.
- USB-TTL adapter (the thing that allows you to communicate directly over-the-wire with the sensor)
- BusPirate This is what the mighty Teague uses, and I recommend it. I used the v5 for this, but the v6 is already out! $40-80
- Cheapie Amazon Kit (thanks to GreyHat for the rec) $14
- Segger J-Link EDU Mini - $60 on Sparkfun
- 2 x USB A to USB C cables (connecting the Pi to the SD card and the Bus Pirate to your computer)
- Dupont wires for connecting the Bus Pirate to the sensor - $7
If you want a fancy case for your Pi (NOT needed), this is what I use: FLIRC case for Raspberry Pi 4B, about $16
2. Sensor, $60-80
- Dragino LDDS 75 sensor. You can buy one at RobotShop for $60-80.
- The Pi, SD, SSD, and USB cables are Amazon affiliate links. If 300 of you use those I'll probably be able to pay half my annual $12 domain name bill with the commissions.
- I'm doing this whole thing on a Mac. If you're on Windows, there'll be a couple commands that are slightly different, usually stuff like using
CMDinstead ofCTRL. I'll try to call them out as we go.
B. Not-Hardware
- Custom domain. For this tutorial I'll be using mine,
gristleking.dev. If you don't already have a domain, I'd strongly recommend buying one at Cloudflare. They're about $12/year and buying it there makes everything else a little bit easier. - If you have a domain already, you'll need to set up your domain's name servers to point to Cloudflare.
C. Notes on what you "Need"
You don't actually NEED a USB-TTL adapter, but it's generally good practice to have one hanging around the work bench if you're any kind of aspiring nerd. You could use downlinks instead of the adapter to make changes to your sensor, but in practice I've found that to add both complication and time (especially if you have to wait for the next uplink & you get your downlink command wrong...ask me how I know)
You could do this without a custom domain by hosting in the cloud and managing tunnels with Cloudflare, but then you're on the hook for cloud hosting, which is probably $6/month at the cheapest. A domain is something like $70/year for an expensive .ai one and $12/year for a cheap one. Trust me, just buy a domain.
Having your own domain makes part of this workflow way simpler, plus it's just cool to have your own domain. Ask Larry at Google or Steve at Apple. Having a custom domain is cool.
1. Set Up Overview
-
Set Up Your Rasbperry Pi: Basic setup and security
-
Install Services: Node-RED, InfluxDB, Grafana, integrate external SSD.
-
Cloudflare: Set up tunnels, tokens, applications, and policies.
-
Sensor: Get the sensor sending data through MetSci
-
Local Integration Testing: Node-RED flows, integrate InfluxDB, create Grafana dashboards.
-
System Maintenance & Troubleshooting: Keep it rolling smooth, yo.
2. Setting Up Your Rasbperry Pi
A. Basic Setup
Rather than re-writing (and constantly updating) this part, I'm going to suggest you follow the official docs for the first part of this and load Raspberry Pi OS Lite (64-bit). If you've never done it before, that's ok.
The basic flow is to write (or "flash") the OS onto an SD card using your computer, then plug the SD card into your Pi. After that you'll find the Pi on your local network and you can SSH in. All of those things have lots of tutorials on the internet already.
Starting with a fresh OS install is recommended to avoid conflicts with existing packages.
Once you've set up your Pi, connect it to your local network (Ethernet/LAN cable strongly preferred over WiFi). SSH in using Terminal, then update/upgrade with:
sudo apt update && sudo apt dist-upgrade -y && sudo apt autoremove -y
B. Securing Your Pi
Your Pi can be made a bit more secure with a few commands. We're going to wrap them all up into one. This is going to get the latest security patches, make sure everything is up to date, then set some basic firewall rules.
There's nothing ultra fancy in here, just generally good Pi housekeeping.
curl -sSL meteoscientific.com/scripts/secure-pi.sh -o secure.sh && chmod +x secure.sh && sudo ./secure.sh
Once you've run it to the end, it'll ask you if you want to reboot. Just type in y and hit Enter.
If you want to make your Pi significantly more protected, set up keys instead of passwords. Doing that is beyond the scope of this tutorial and is well covered on the interwebz in general. I'd start here if you need help (or have ChatGPT walk you through it).
Let's move on to installing the services we need.
3. Install Services (Node-RED, InfluxDB, Grafana)
A. Service Install Script
Copy & paste the following command into your Pi's Terminal:
curl -sSL meteoscientific.com/scripts/install-dashboard-v3.sh -o dashboard.sh && chmod +x dashboard.sh && sudo ./dashboard.sh
During the installation you'll get a few questions and warnings.
If you have a 4GB RAM Pi, you'll see a warning message about performance. This is just to clarify that if you want to run a shitload of sensors frequently you'll probablly be better with an 8GB RAM Pi. For most people, 4GB is fine and 8GB is overkill.
The script will set up your "Organization" name (used in the database). The default is MeteoScientific, feel free to change that if you'd like. This is mostly a structural thing, so just use something descriptive.
It'll also set up a bunch of random sci-fi usernames for the various services.
You can accept all the defaults and be fine, or feel free to change them if you want different user names. Don't get too twisted up with it; again, the defaults are fine.
Make sure you copy down your credentials when you see 'em at the end. They'll be saved to a file in your home directory just in case, but you really should copy them down and then delete that file before you move on.
After installation, visit your shiny new setups:
- Node-RED: http://your-pi:1880
- InfluxDB: http://your-pi:8086
- Grafana: http://your-pi:3000
DON'T skip copying down your credentials (instructions are at the end of the script) and then deleting that file.
cat /home/<YOUR-USER>/metsci-credentials.txt
That will print out your credentials, which you'll need to use later. Save those somewhere safe, then delete the file with:
rm -rf /home/<YOUR-USER>/metsci-credentials.txt
B. Integrate External SSD
Now that your services are installed, let's make sure InfluxDB is using the SSD.
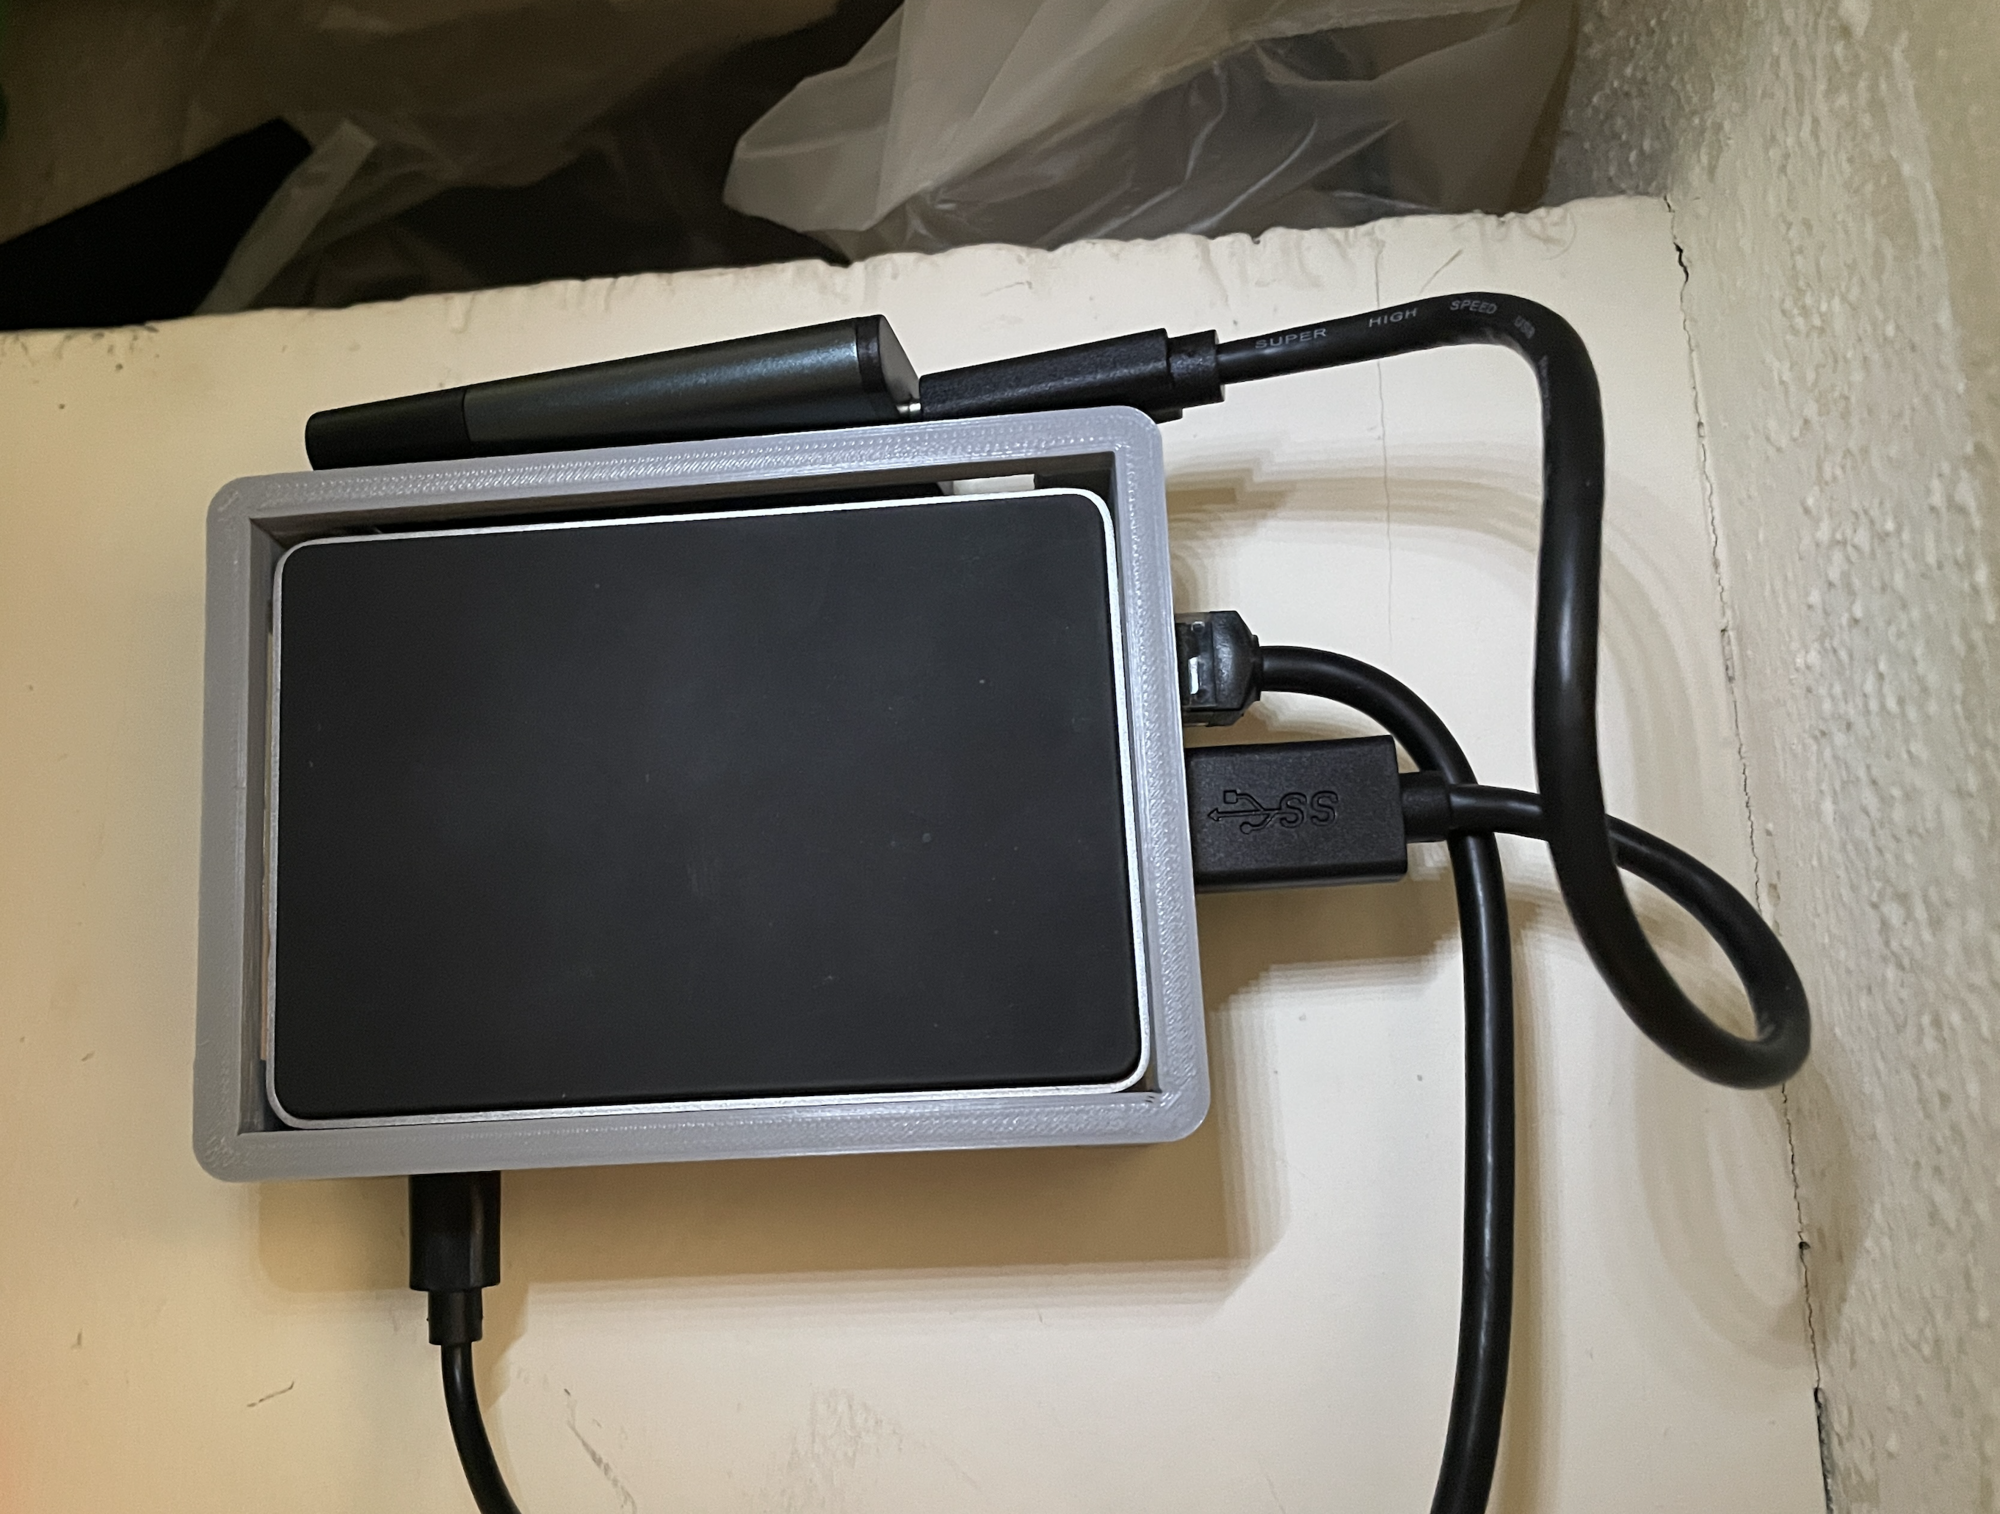
Using a USB cable, connect your external SSD to one of the USB 3.0 ports on your Pi. Here I'm using PoE to power and connect the Pi, and the SSD is just laid on top. The case is a 3D print so I can mount the Pi on the wall in my server (and clothes) closet.
Then, in your Terminal:
- Verify the SSD is detected:
You should see something like this:
lsblkcore@myrmytron:~ $ lsblk
NAME MAJ:MIN RM SIZE RO TYPE MOUNTPOINTS
sda 8:0 0 111.8G 0 disk
└─sda1 8:1 0 111.8G 0 part
mmcblk0 179:0 0 116.2G 0 disk
├─mmcblk0p1 179:1 0 512M 0 part /boot/firmware
└─mmcblk0p2 179:2 0 115.7G 0 part /
See how my sda lists sda1? We'll use that sda1 in this next command; yours may be named differently.
- Mount the SSD to a permanent location, e.g.,
/mnt/ssd:sudo mkdir -p /mnt/ssd
sudo mount /dev/sda1 /mnt/ssd - Set the ownership for your user. In my case, that's
core. You may have named yours different. Replace core:core with your user name.sudo chown -R core:core /mnt/ssd - Open up
/etc/fstabso we can set this up for persistence.In yoursudo nano /etc/fstab/etc/fstab, add a line like this, replacingsda1with the correct partition identifier fromlsblkabove.Save and exit with/dev/sda1 /mnt/ssd ext4 defaults 0 2CTRL-X, theny, thenEnter.
Nice work!
Now make sure you did that right. Verify SSD with the following commands:
After mounting:
-
Check mount:
lsblk# You should see your SSD mounted at /mnt/ssd
NAME MAJ:MIN RM SIZE RO TYPE MOUNTPOINTS
sda 8:0 0 111.8G 0 disk
└─sda1 8:1 0 111.8G 0 part /mnt/ssd -
Verify permissions:
ls -l /mnt/ssd`
You should see something like this:
total 16
drwx------ 2 core core 16384 Nov 30 14:41 lost+found
The lost+found directory is normal for a fresh ext4 filesystem.
- Test write access:
touch /mnt/ssd/test.txt
Verify it was created
ls -l /mnt/ssd/test.txt
You should see something like:
-rw-r--r-- 1 core core 0 Jan 4 22:45 test.txt
Clean up
rm /mnt/ssd/test.txt
If any of these commands fail with "permission denied", your ownership isn't set correctly.
Nice work, you've set up the major components of your dashboard. Now let's set up the Cloudflare tunnel to securely move data between your Pi and the internet.
4. Cloudflare: Tunnels, Applications, and Tokens
Cloudflare provides a secure connection called a "tunnel" between your Pi and the internet. Within a tunnel will be different public hostnames for different services, like node-red.gristleking.dev for Node-RED and grafana.gristleking.dev for Grafana. We'll use those to connect our Pi to the internet in a secure way.
Think of a tunnel like a big PVC pipe that connects your Pi to the internet. Within that pipe are lots of individual pipes that carry separate types of information to different places. Each individualpipe is a public hostname in the tunnel, and within those pipes you'll split it out even further into different Applications that manage the data from different types of sensors.
Cloudflare changes and updates all the time, so the screenshots and instructions below may be slightly different than what you see in Cloudflare.
Before we set up the tunnel, we're going to build the access control we need to keep our Pi secure.
A. Set Up Zero Trust
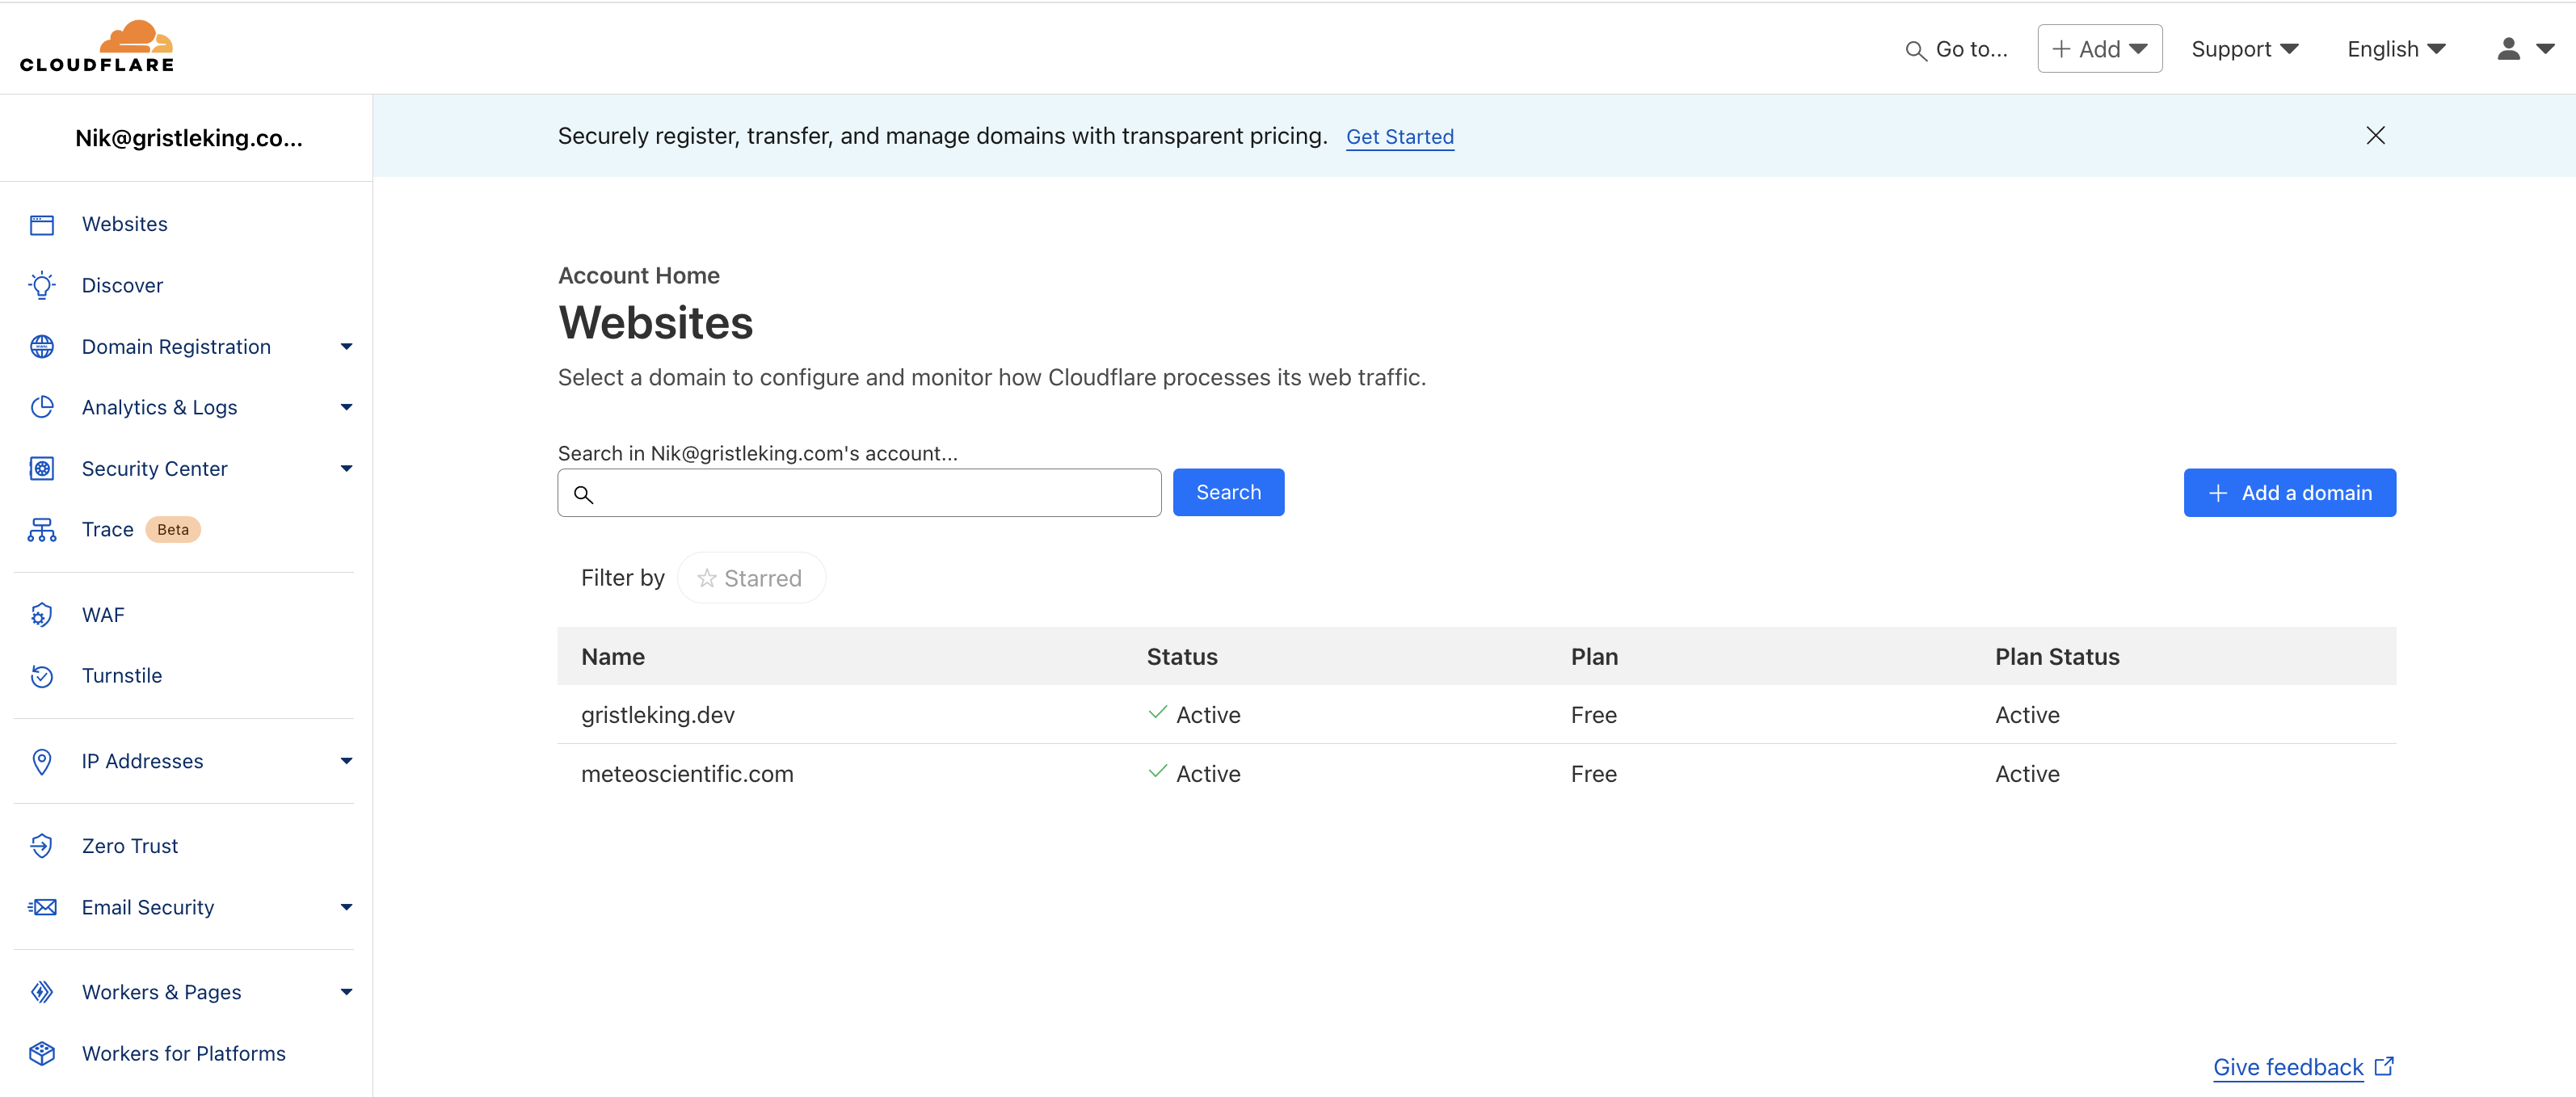
To start this off, login to Cloudflare. I'm assuming you've already set up your domain with Cloudflare, so when you log in you'll see something like this:
You'll need to set up your Zero Trust account in Cloudflare (relax, it's free).
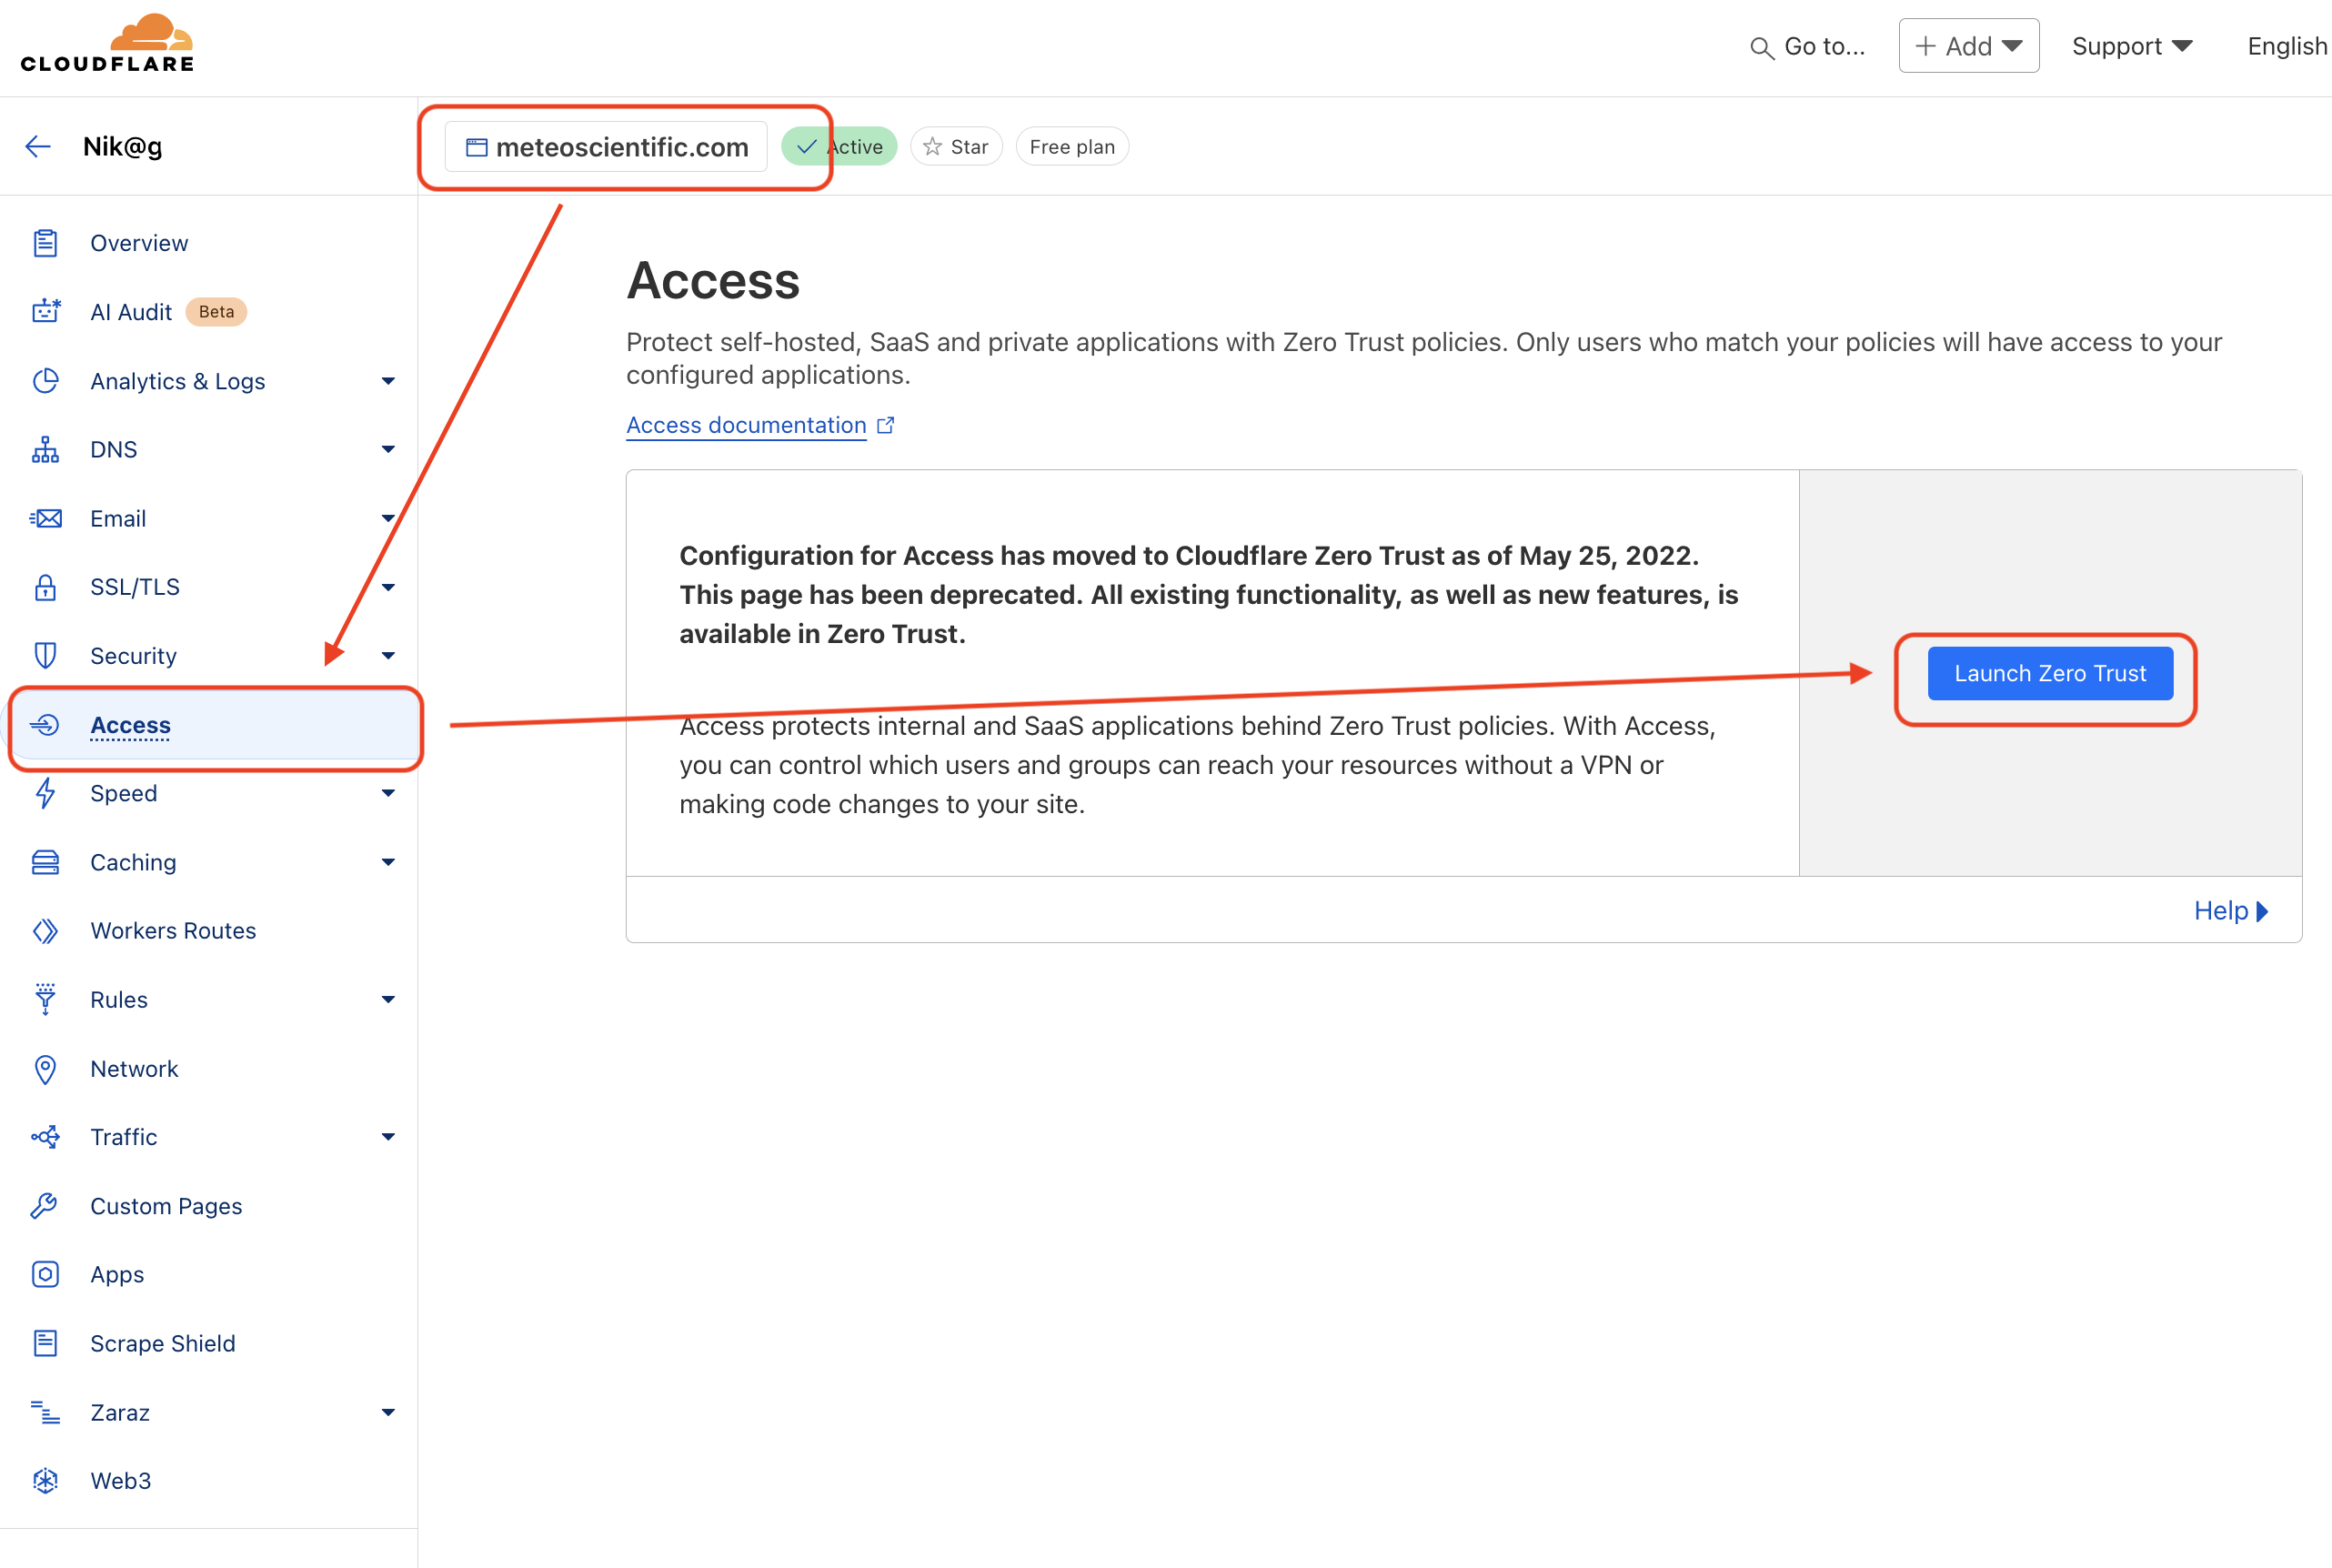
If you haven't set up Zero Trust yet, you may not see "Zero Trust" in your menu. If that's the case, navigate to your domain name, look for Access in the left menu, then hit the Launch Zero Trust blue button on the right, then click it and set up Zero Trust.
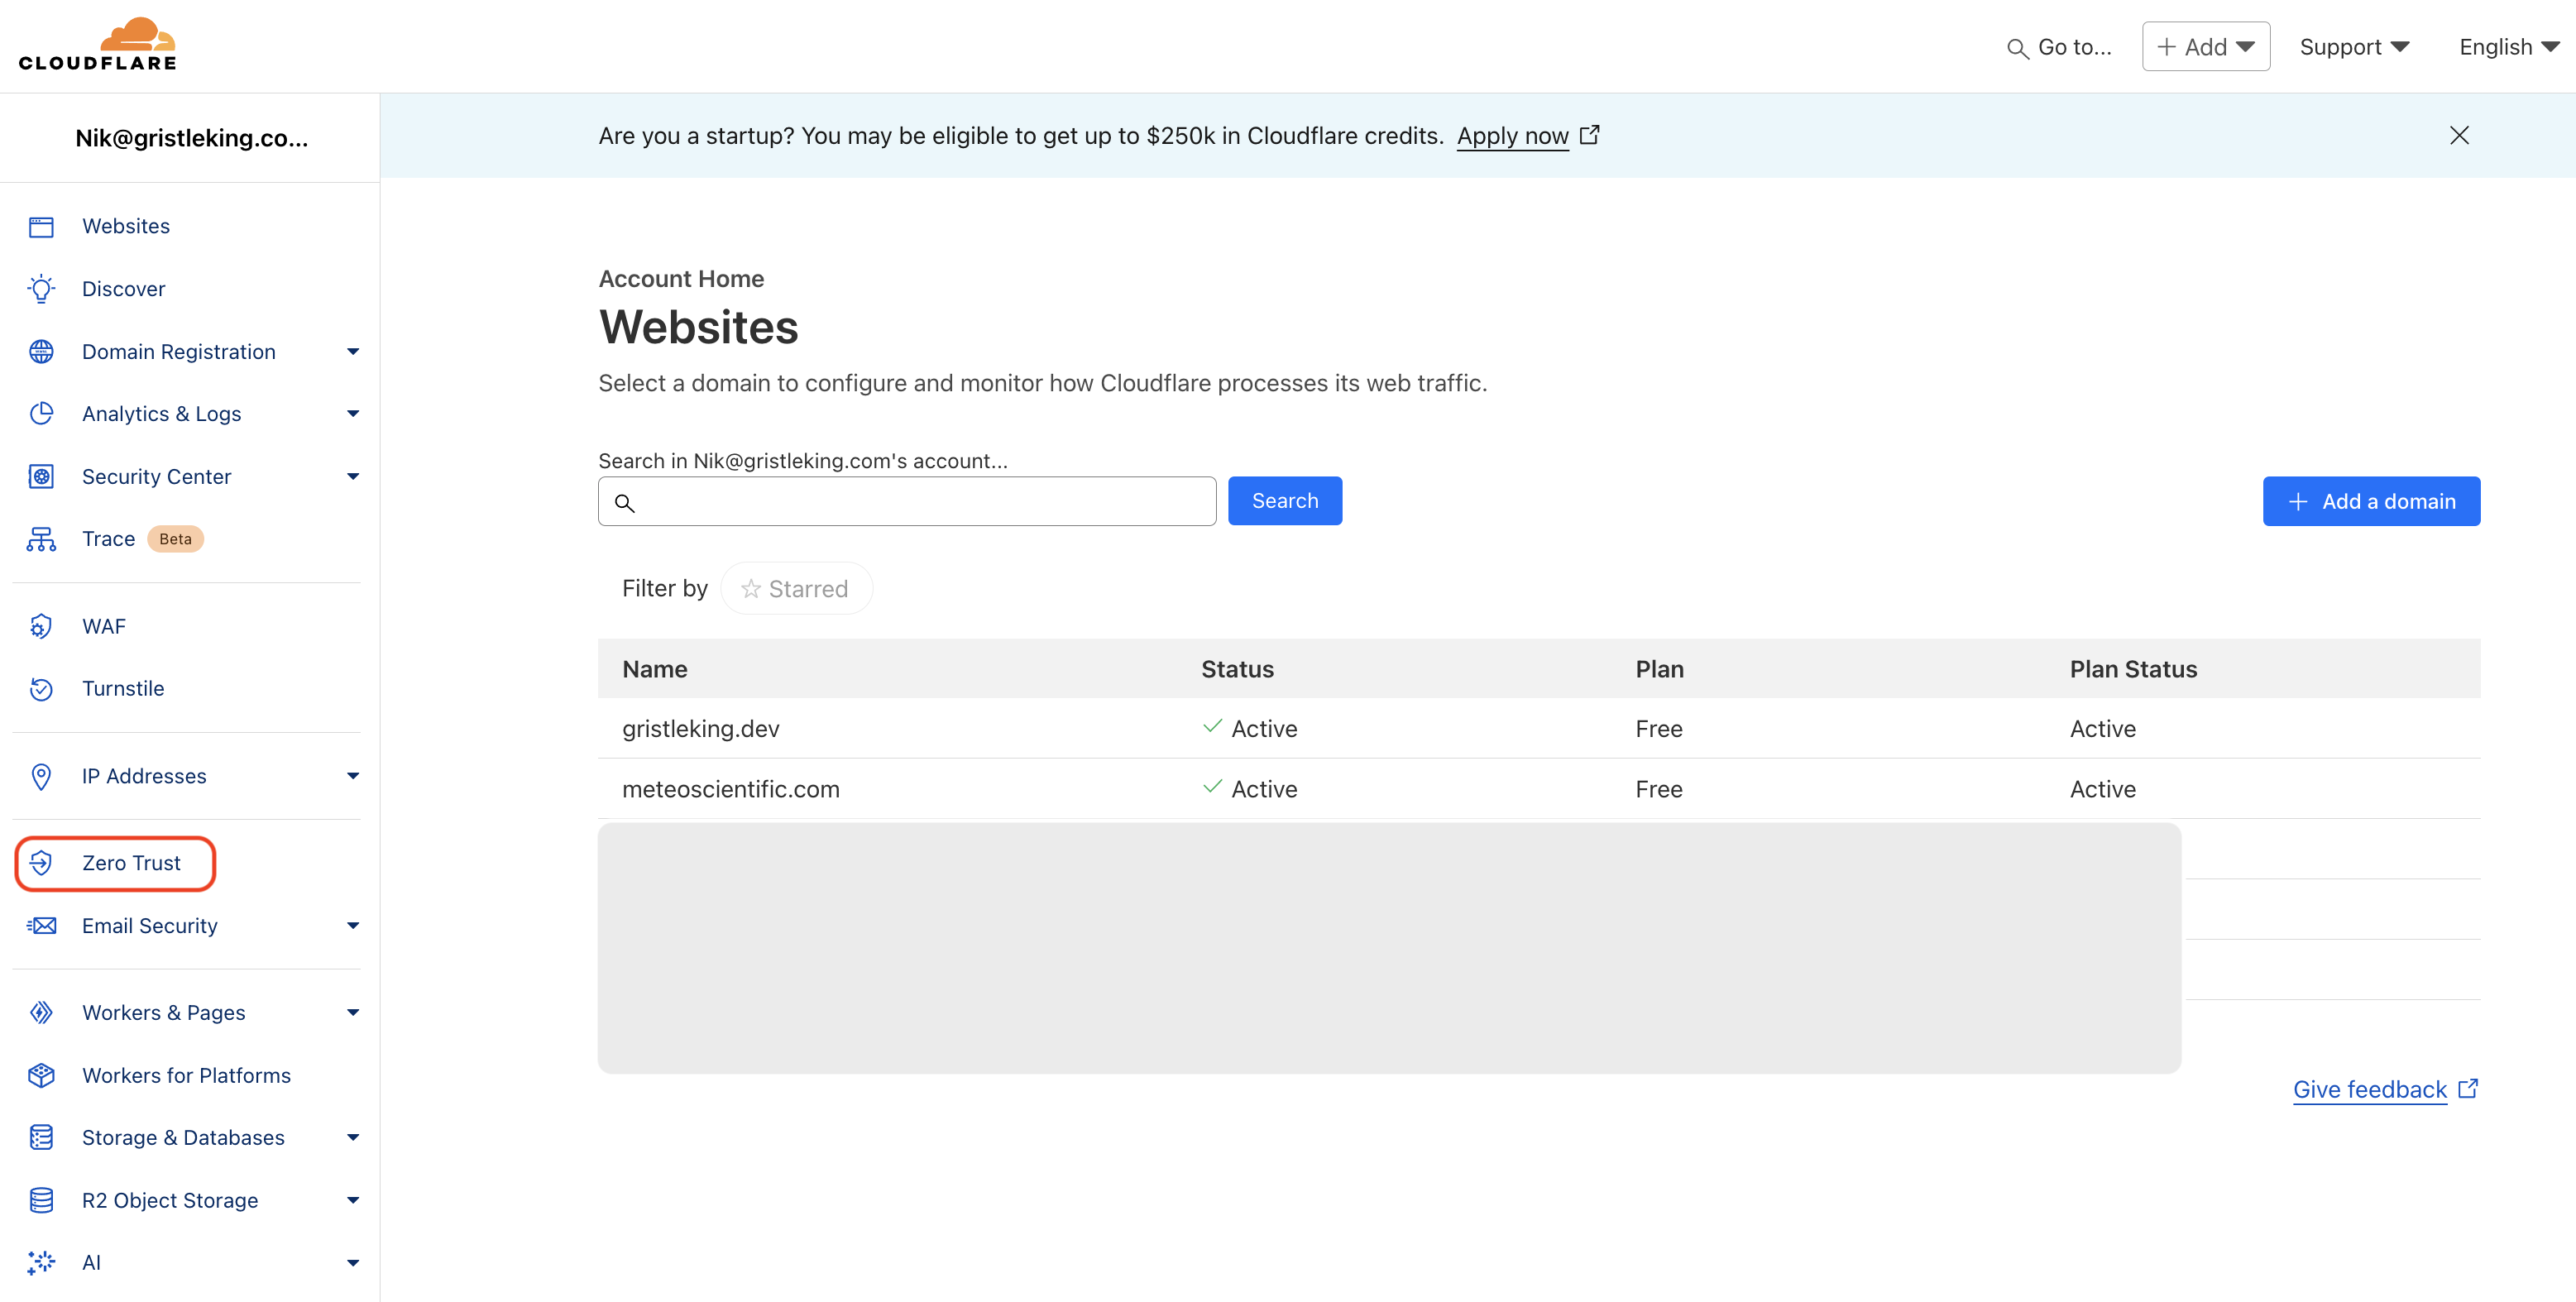
Once you have it, you'll see it in your Main (not your domain) Cloudflare menu, like this.
With Zero Trust on and ready to go, let's set up all the access control we need before connecting our Pi to the internet.
B. Zero Trust Token & Application Setup
With our public hostnames set up we'll need to protect them so that not every jackass and their brother can drop into our Node-RED or Grafana instances. We'll do that with Cloudflare's Zero Trust.
For each public hostname, we'll create Applications and Tokens to manage access for them. In general, we don't want the public to have any access to our Node-RED instance, but we do want to share our Grafana dashboard with the public.
Let's start with the Node-RED Application and Token, focusing on what we'll need for the LDDS75.
We'll need three things in order to manage access in Cloudflare Zero Trust:
1. A Service Token
2. A Zero Trust Application
3. A Zero Trust Policy Rule
The use of the word "Application" can be a bit confusing here, as we have both Cloudflare Applications and MetSci Applications.
Remember, a MetSci Application is a group of sensors that share the same data structure. If you were monitoring 30 rainwater tanks with 30 LDDS75 sensors, all of the sensors would be in one MetSci Application, which would map to one Cloudflare Application.
A Cloudflare Application is used to manage a Zero Trust setup. In our case, we'll use Service Tokens as a gatekeeper ("No token no entry") as well as a routing requirement, where the LDDS75 token will help route all the LDDS75 data to the Node-RED instance.
1. Create Service Tokens
In Cloudflare, back in Zero Trust, go to Access-->Service Auth and click Create Service Token.
We'll start with a Service Token for Node-RED. Name your token something descriptive (I'll use ldds75) and set the duration to Non-expiring.
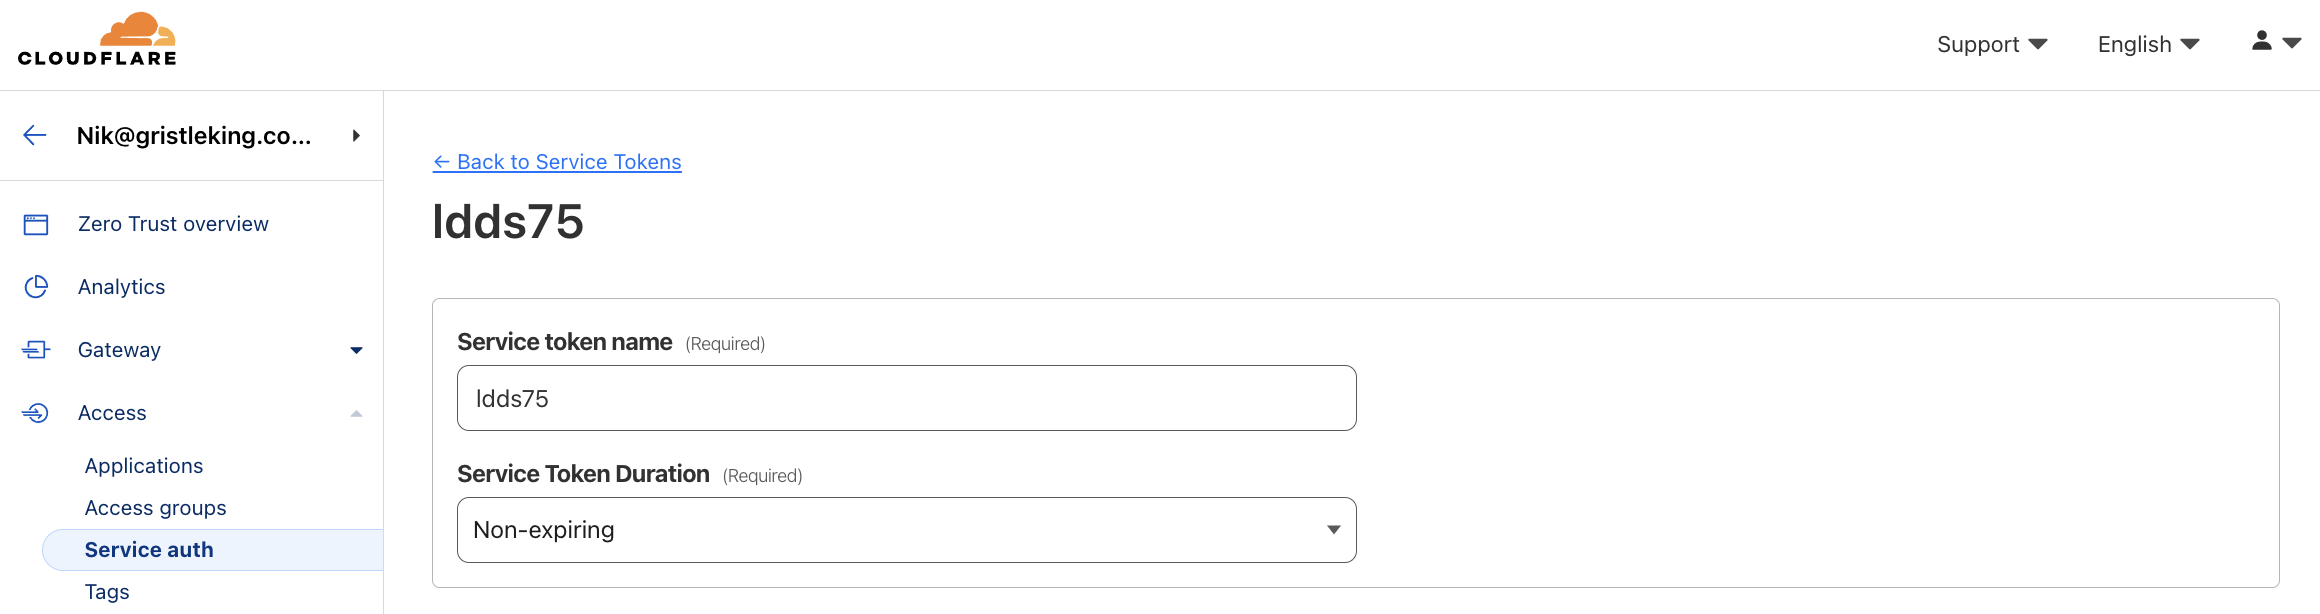
That will give you an Access ID and an Access secret. Save both the headers and the access codes in a secure place. We'll need them when we set up the HTTP integration in MetSci. What you save should look like this:
CF-Access-Client-Id: 5xxxxxxxxxxxxxxxxxxxxxxxx3.access

CF-Access-Client-Secret: ffxxxxxxxxxxxxxxxxxxxxxxxxxxxxxxx2
Hit the Save button at the bottom right.
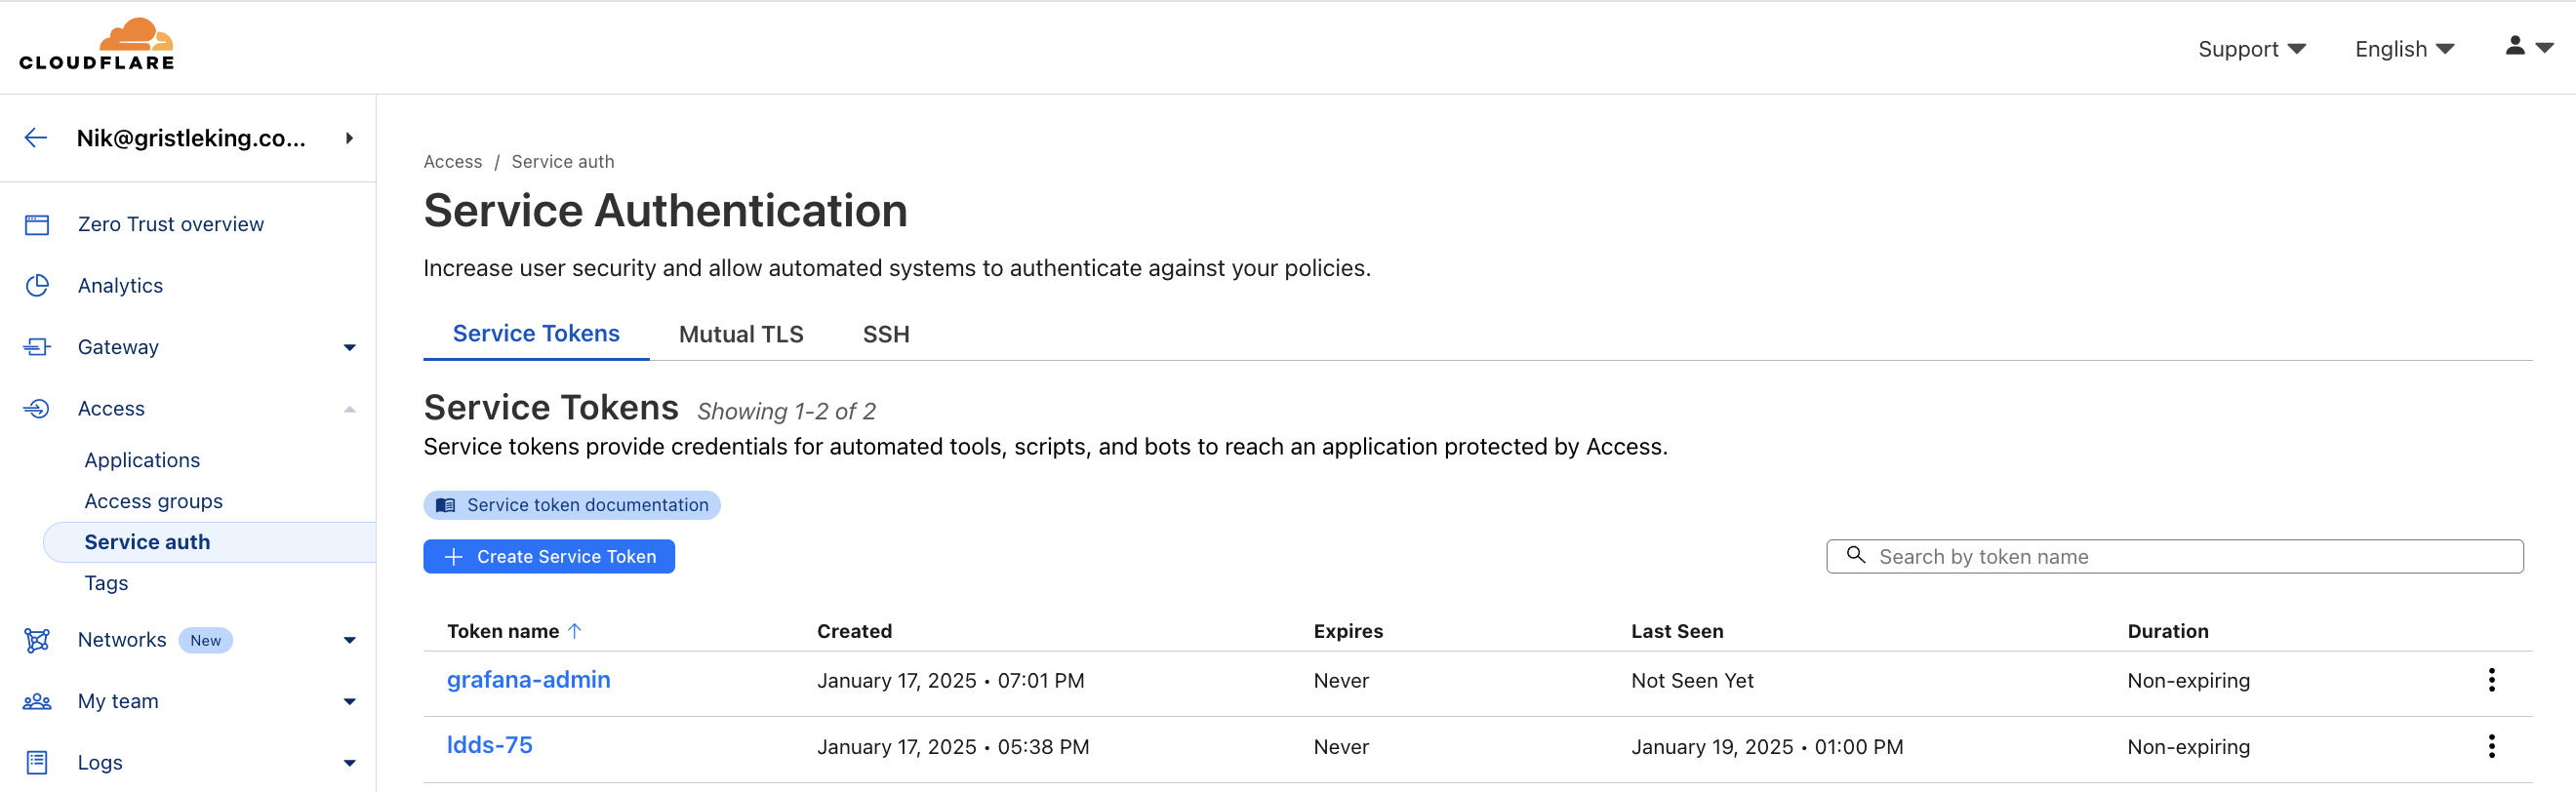
Using that same process of Access-->Service Auth-->Create Service Token, create another Service Token for Grafana. I'll use grafana-admin. When you're finished, you'll have two Service Tokens, like this:
C. Zero Trust Applications
We're going to set up 4 Applications. Two for NOD-RED, and two for Grafana. They'll do slightly different things, but the process of setting them up is the same.
Node-RED Applications
Go to Access-->Applications and add a new Cloudflare Application.
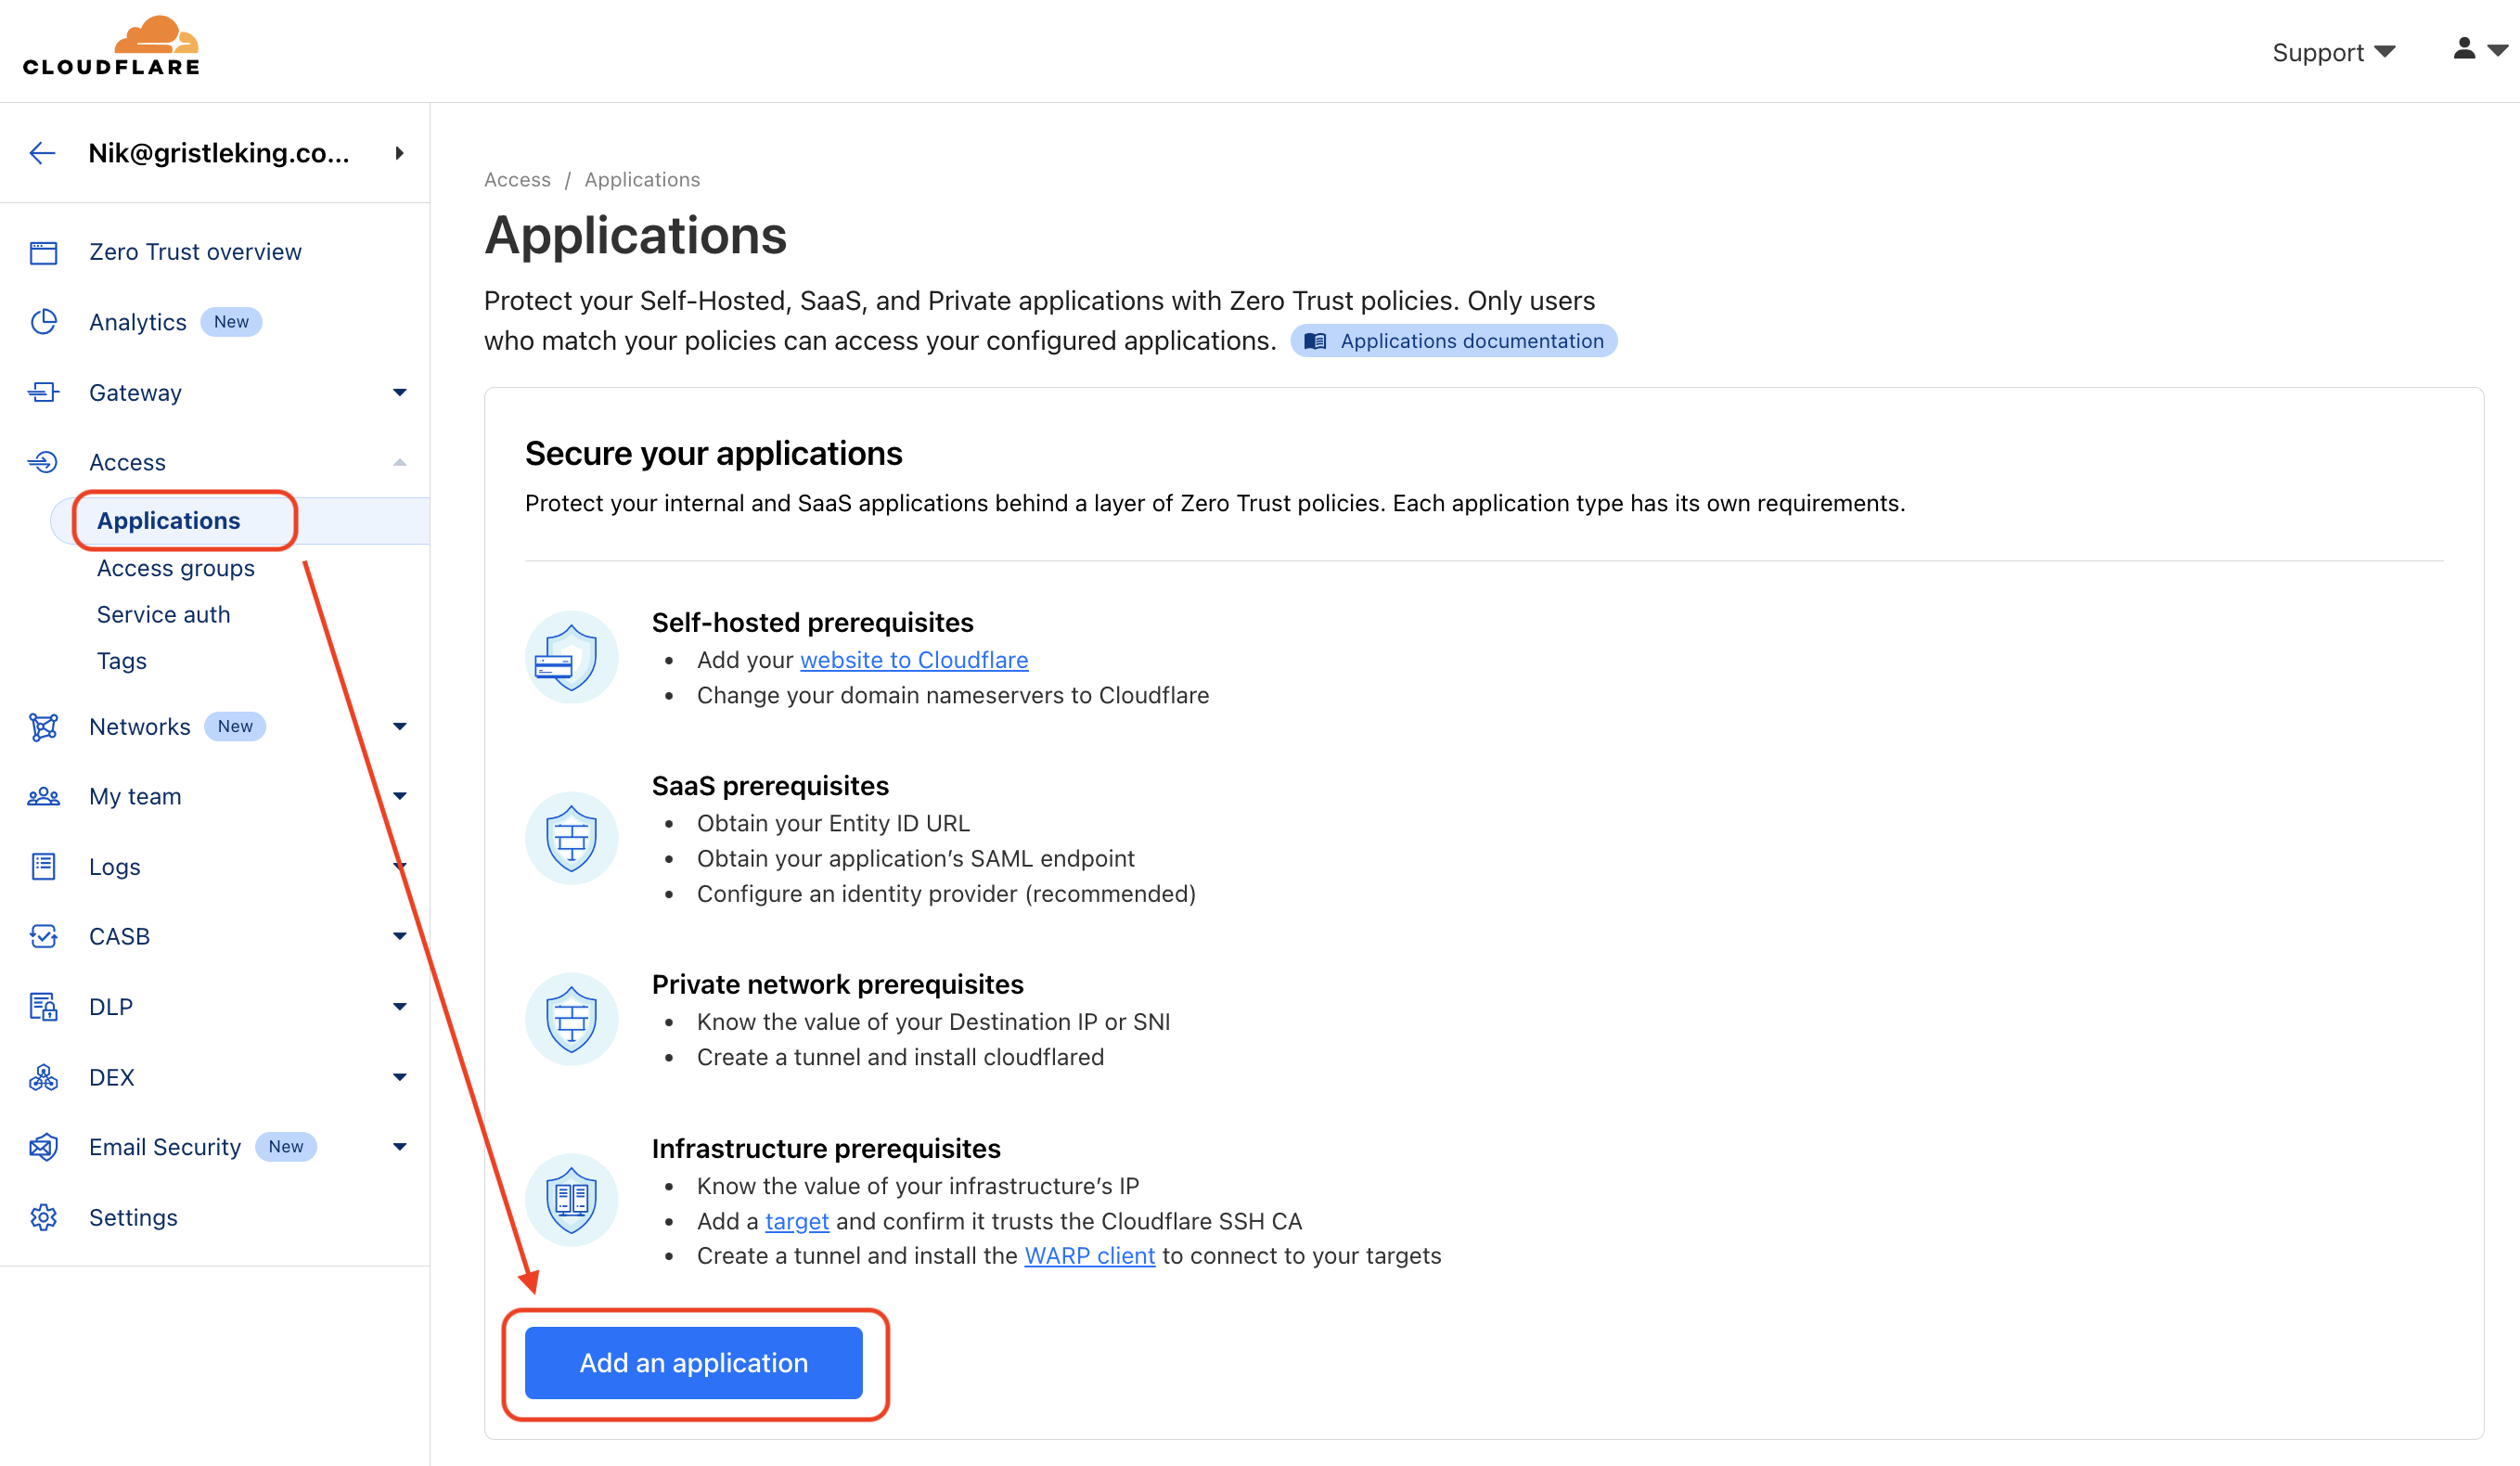
Select Self Hosted
In Node-RED, we don't want any public access, so we'll set up a global gatekeeper and then a specific application to allow our MetSci LDDS75 data to pass through.
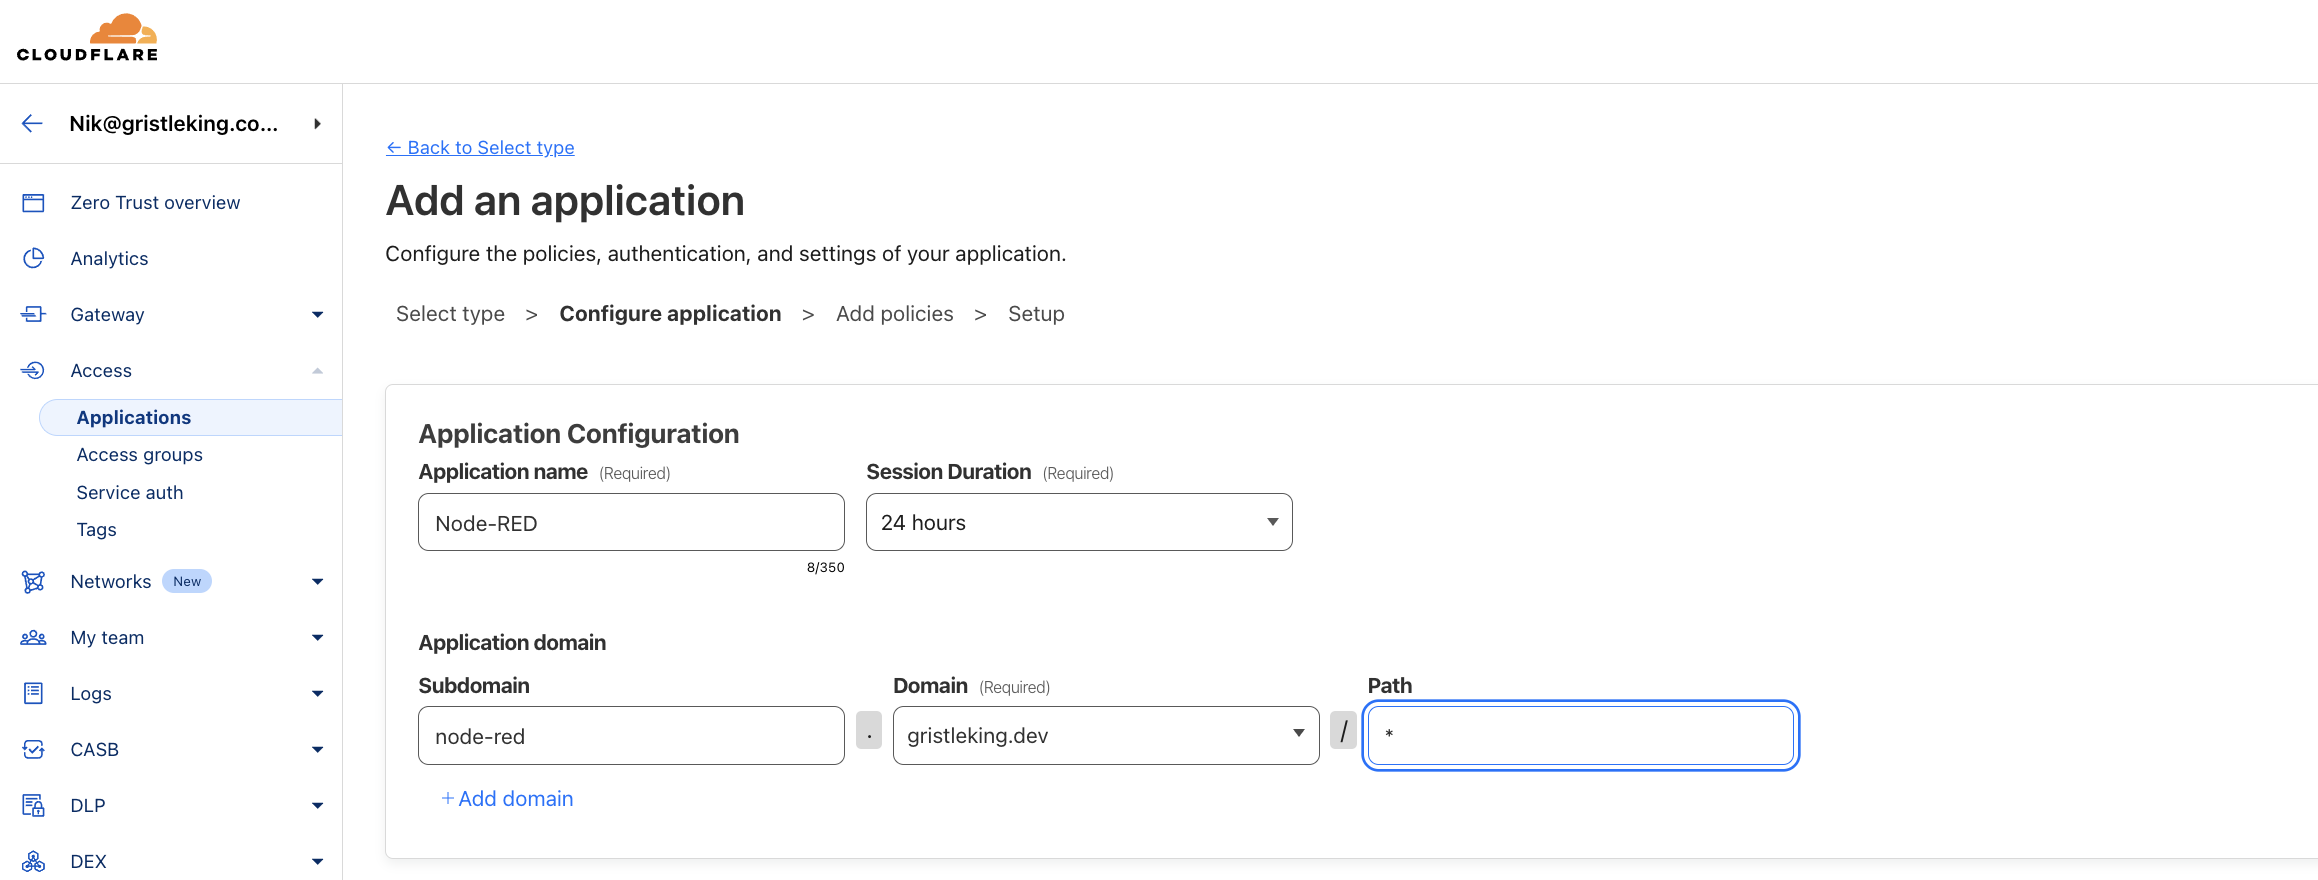
Node-RED Application - Global
Let's start with the global Node-RED application.
Set the Application name to Node-RED and set the Session Duration to 24 hours. Then set the subdomain to node-red, the domain to <YOUR-DOMAIN>.com, and the path to *.
Scroll down to the bottom and click Next to proceed to the Policies section. Here we'll set up a Policy rule that requires anything using this Application to have a valid token.
Node-RED Policy Rule - Global
Set the policy name to Node-RED and set the Action to Service Auth, leave the duration as is.
Scroll down a bit until you see Configure rules. On the Selector choose Any Access Service Token. It will automatically fill in a value of Any non expired Service Token will be matched.
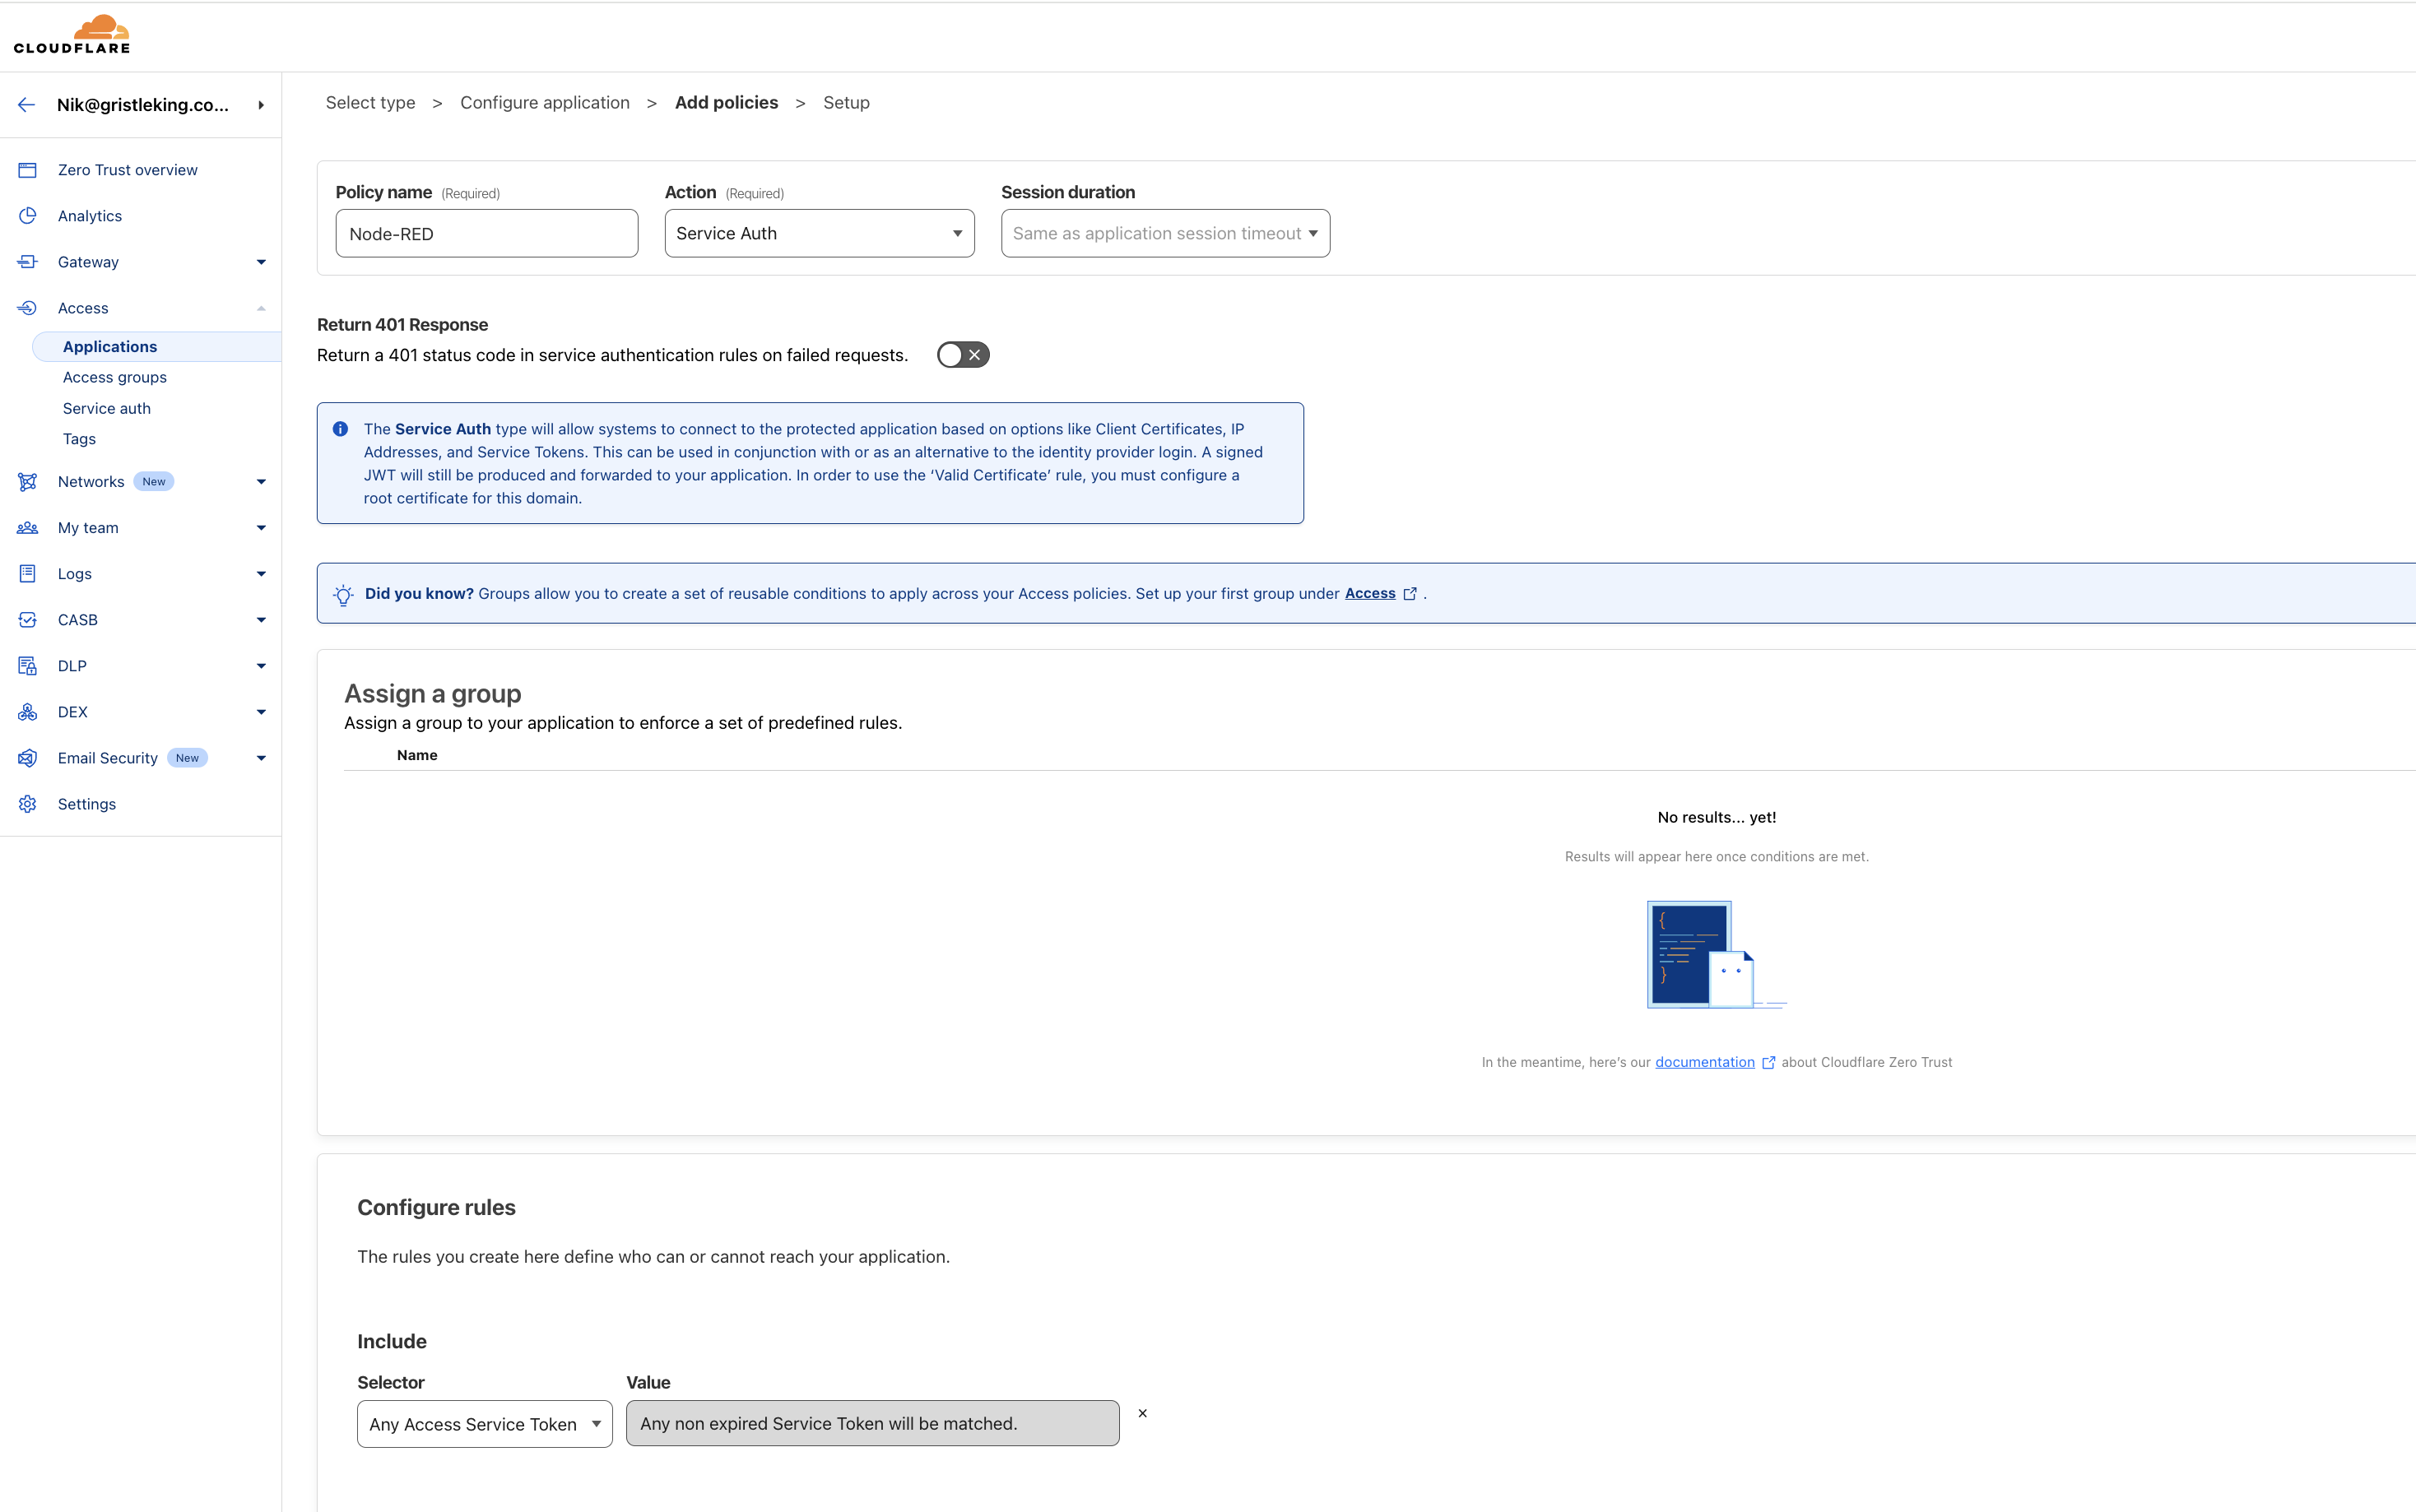
Hit Next and scroll down to the bottom of the next page (past CORS, Cookies, and Additional Settings), then click Add Application.
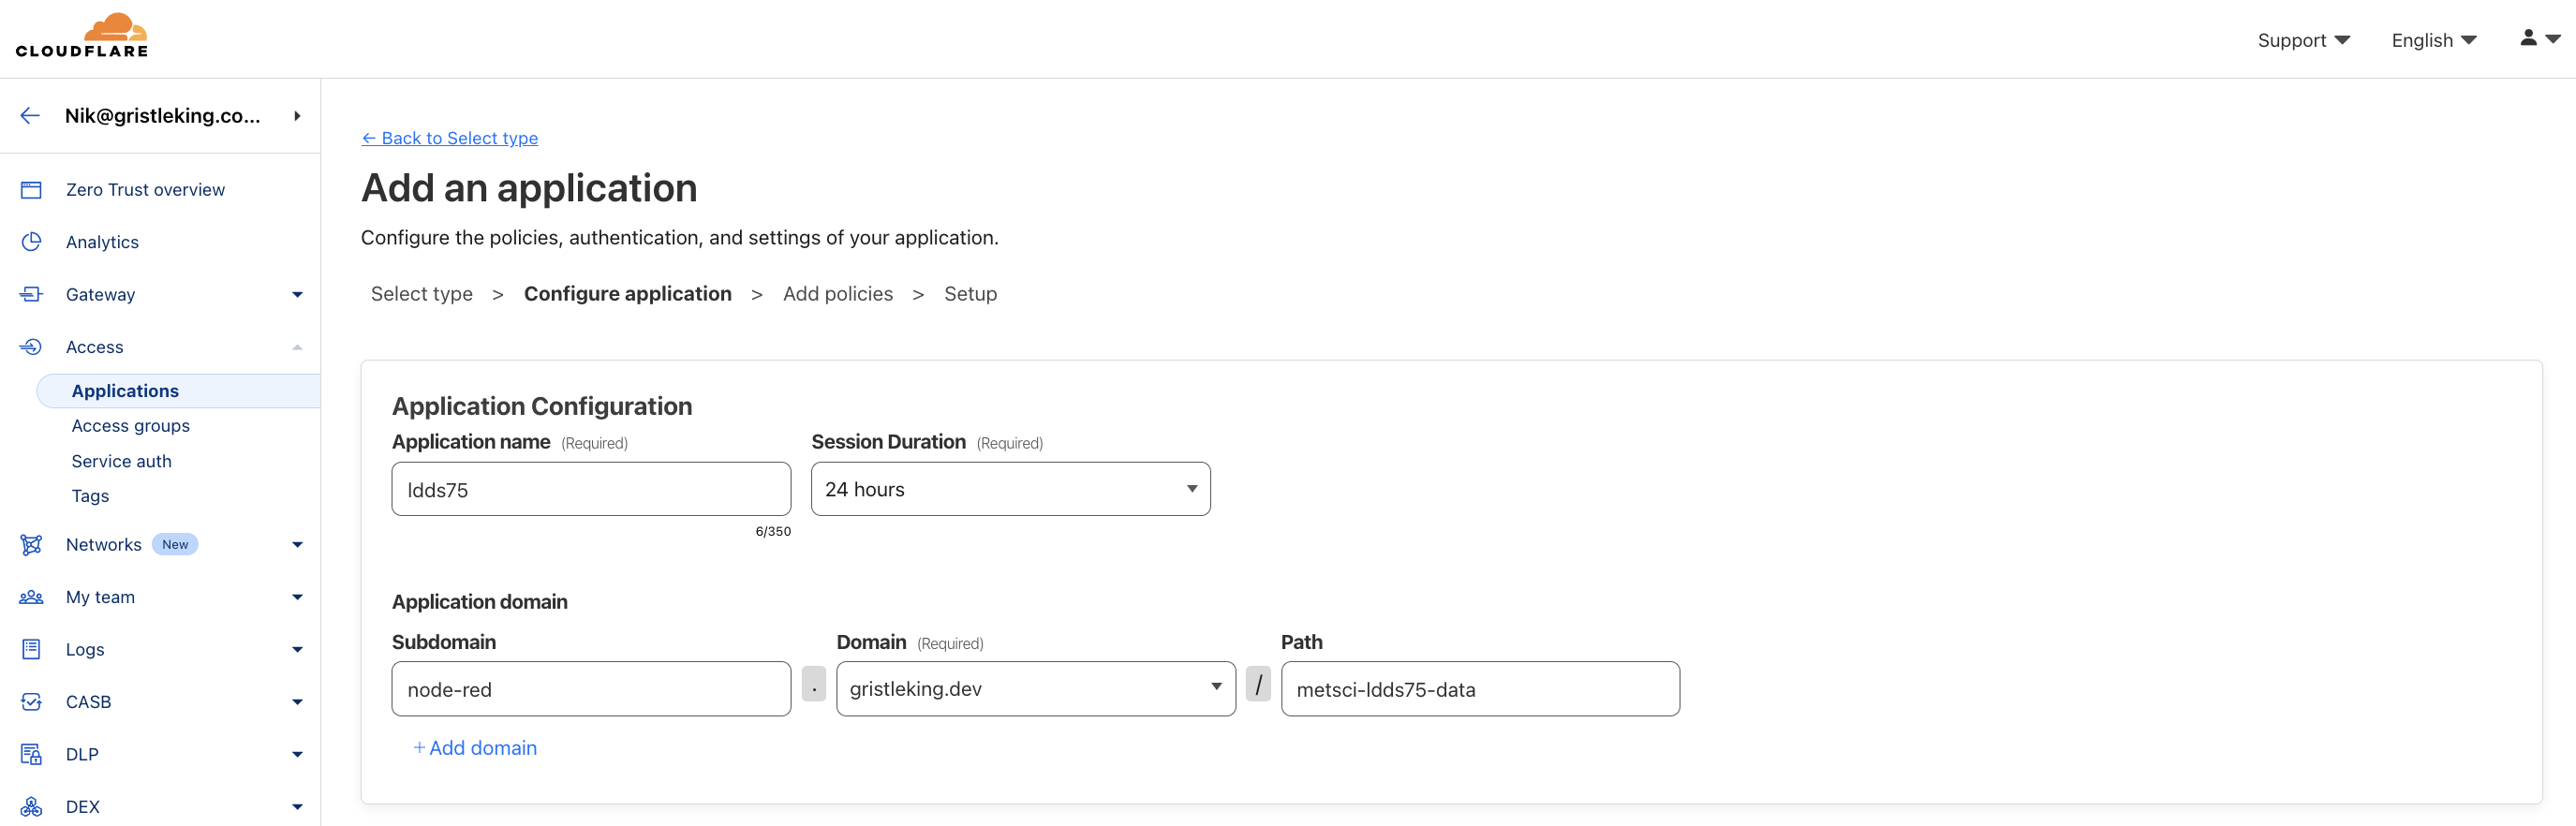
Node-RED Application - LDDS75
Now you'll create the LDDS75 Application, which will only apply to our LDDS75 data. Hit the Add Application, then Self Hosted (just like last time), then give it a descriptive name like ldds75.
Leave the session duration at 24 hours then enter the subdomain, domain, and path it'll use.
In this case, use node-red . gristleking.dev / metsci-ldds75-data.
We'll use the metsci-ldds75-data path later when we set up our Node-RED flow.
Scroll down past Application Appearances and Tags etc to the bottom.
Click Next to proceed to the Policies section.
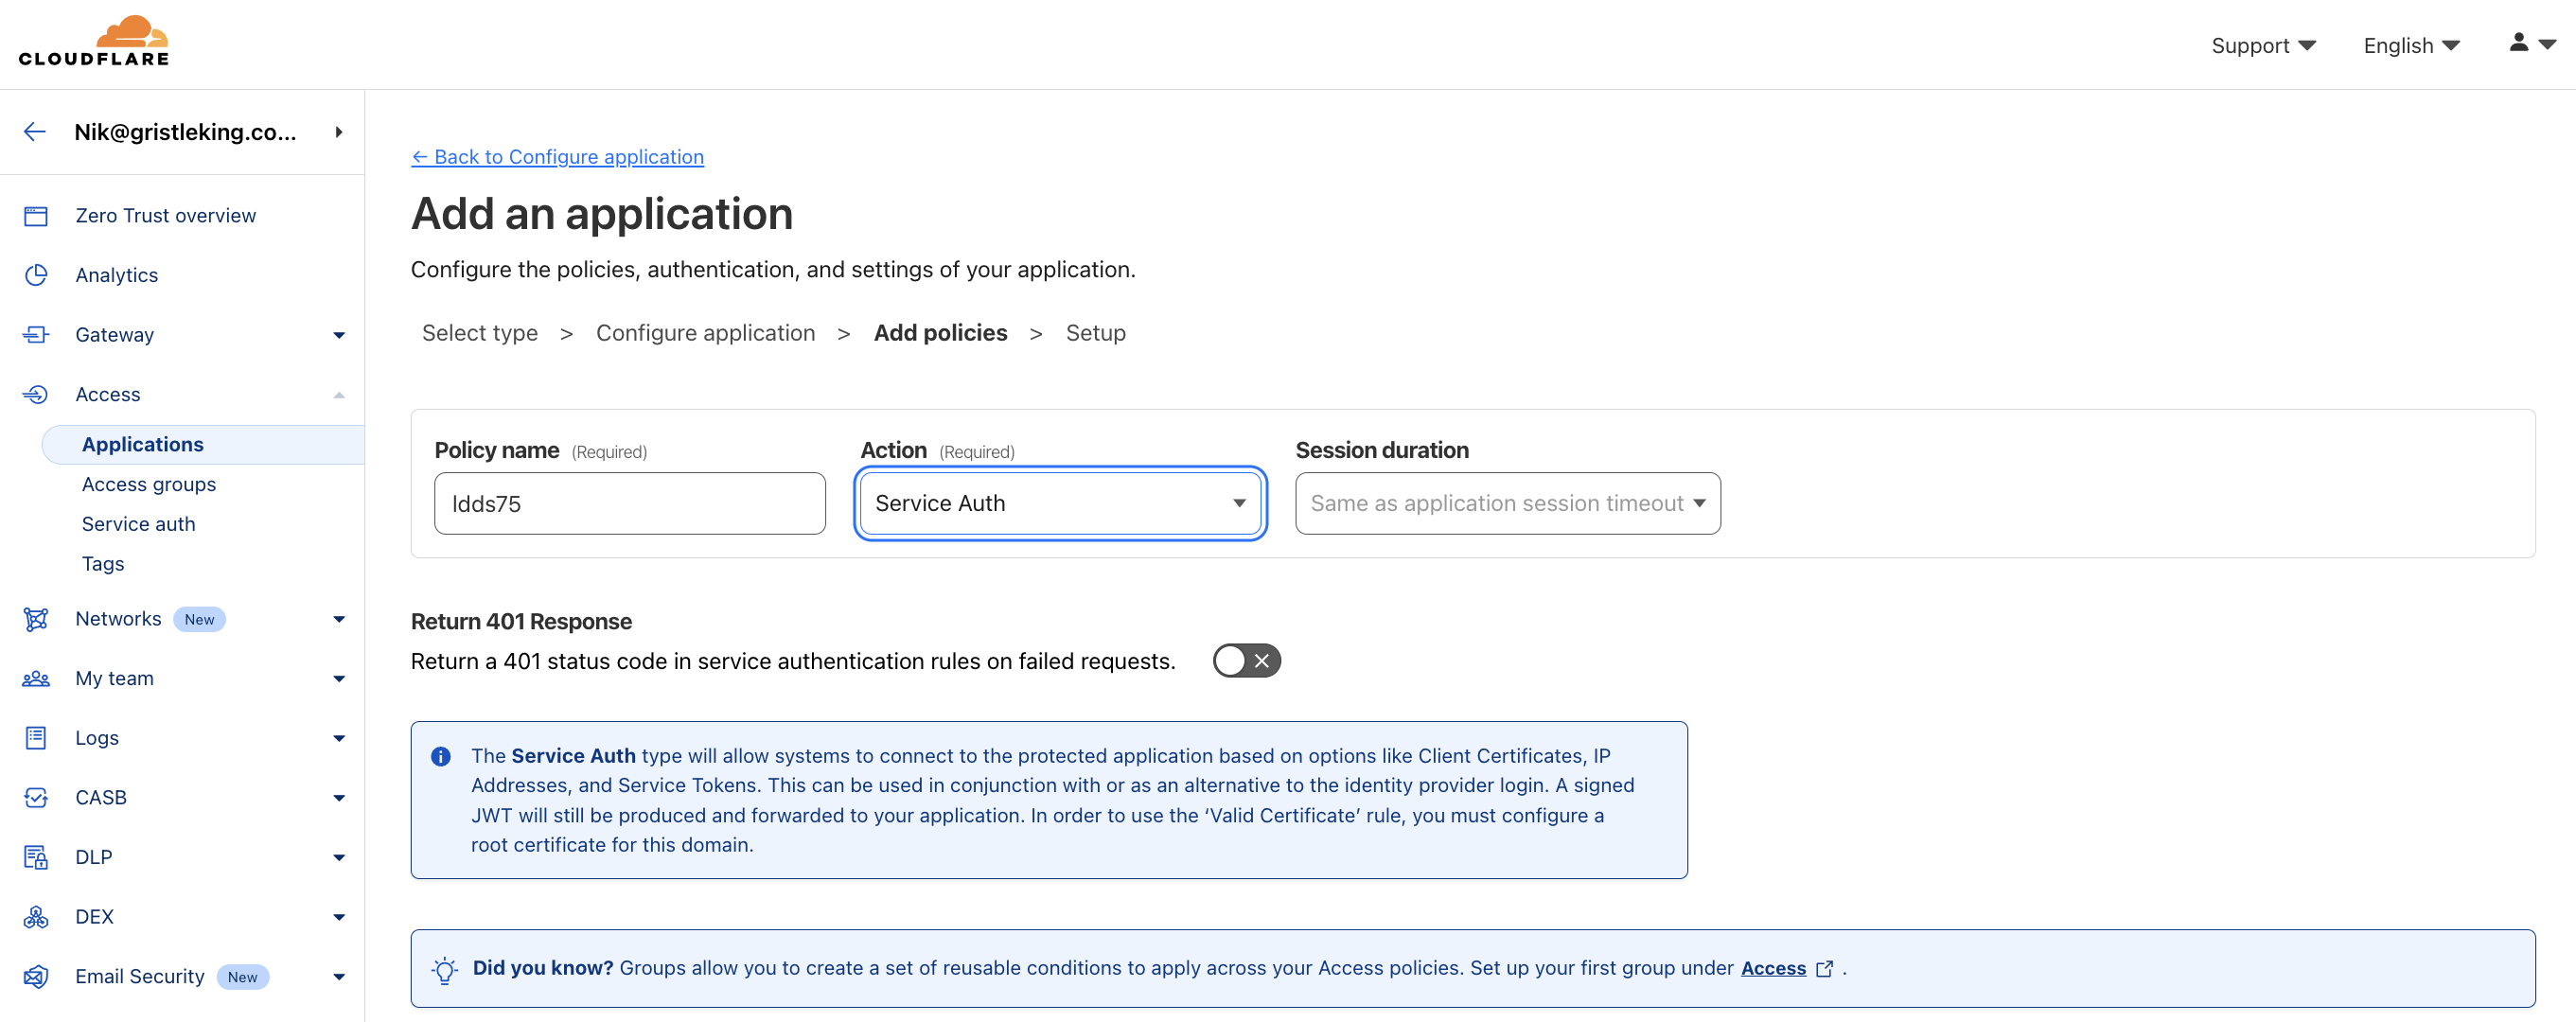
Node-RED Policy Rule - LDDS75
We'll use the same Service Auth policy as the global application, but this time we'll restrict it to the ldds75 token we've set up.
Set the policy name to ldds75 and set the Action to Allow, leave the duration as is.
Scroll down to Configure rules. On the Selector choose Service Token, then select the Service Token you just created.
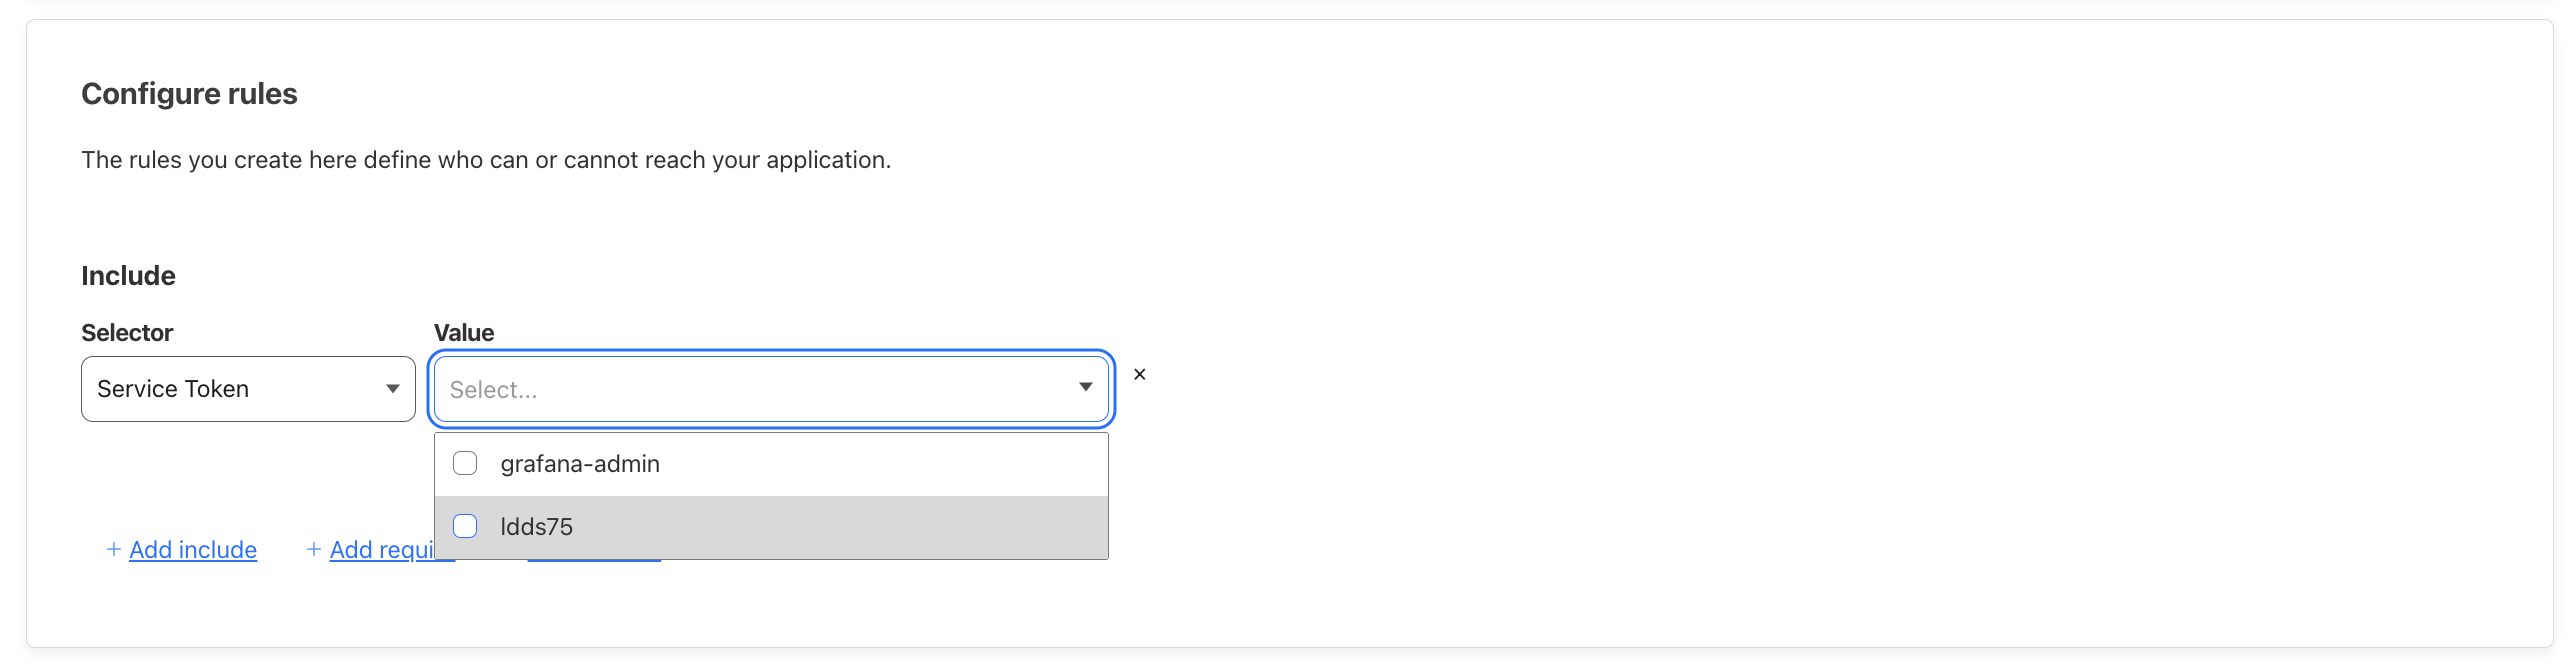
Click Next, then scroll through the next page, past CORS settings, Cookies settings, and Additional settings. Click Add Application at the bottom right and you're done with the Node-RED Applications.
Grafana Applications
Ok, now we'll set up the Grafana Applications. Unlike Node-RED where we're blocking ALL access to the public, this time we want to block access to the Grafana admin side but allow public access to specific Grafana dashboards.
Since you've already set up two Applications, I'll go a little faster.
Grafana Application & Policy - Access Control
Zero Trust --> Access --> Applications --> Add Application --> Self Hosted
Application name: `Grafana Access Control`
Session Duration: `24 hours`
Subdomain: `grafana`
Domain: `<YOUR-DOMAIN>.com`
Path: `*`
Scroll down to the bottom and click Next to proceed to the Policies section.
Add a policy with the following:
Policy name: Token Auth
Action: Service Auth
Session Duration: Same as application session timeout

Scroll down and

Configure rules:
Include: Any Access Service Token
Value: Any non expired Service Token will be matched
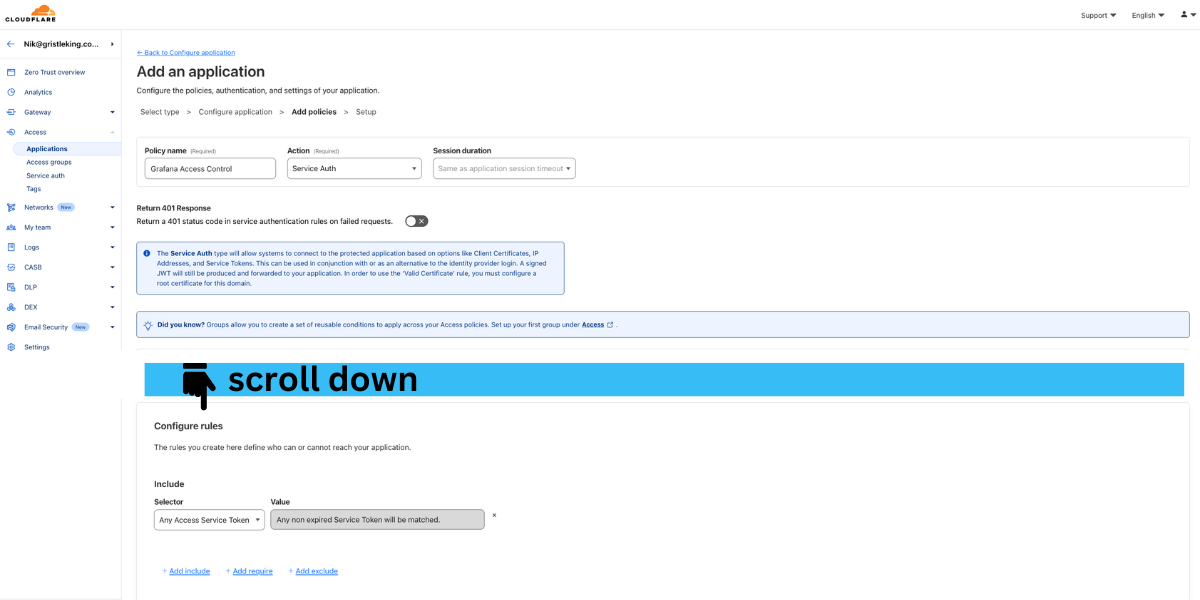
Scroll down to the bottom of the next page and click Add Application. You don't need to set up a specific Service Auth token for this, you just need to require that any service token is needed to access Grafana except for viewing public dashboards. We'll set that Application and Policy up next.
Grafana Application & Policy - Public Access
Zero Trust --> Access --> Applications --> Add Application --> Self Hosted
Application name: `Grafana Public Access`
Session Duration: `24 hours`
Subdomain: `grafana`
Domain: `<YOUR-DOMAIN>.com`
Path: `public*`
Then add two more domains, with two different paths:
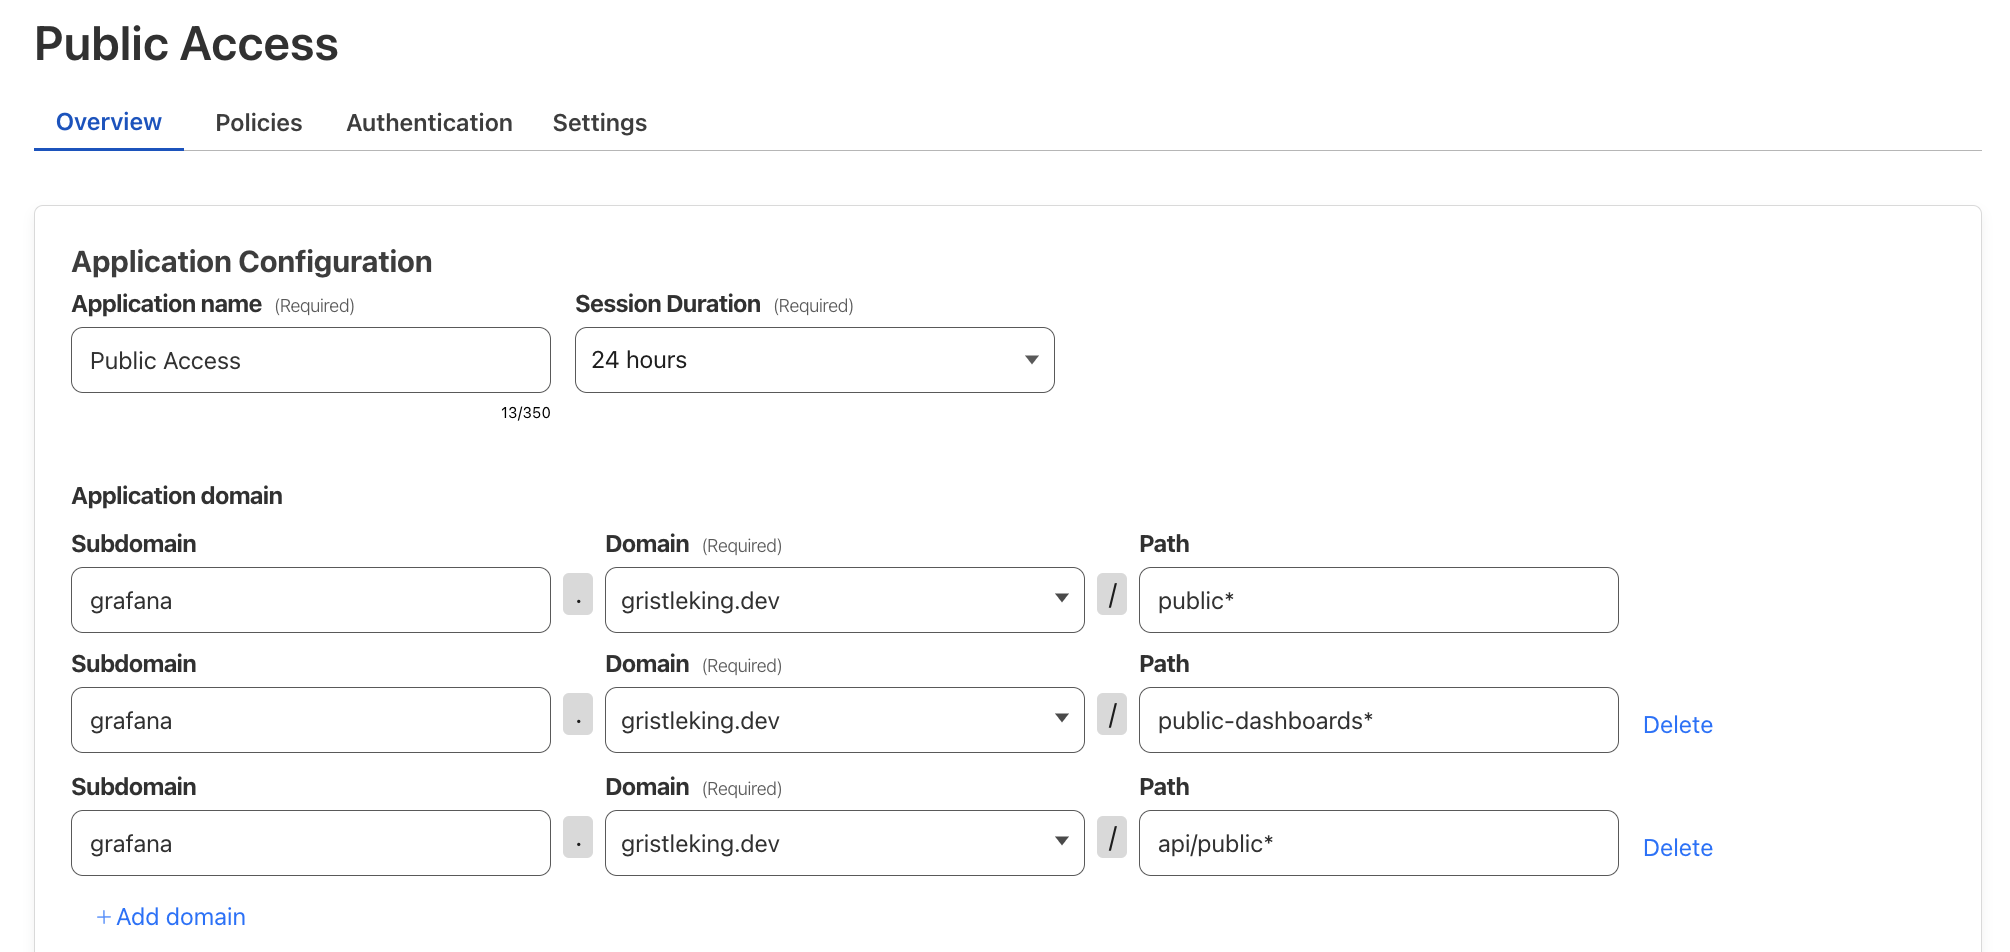
- Subdomain: `grafana`
- Domain: `<YOUR-DOMAIN>.com`
- Path: `public-dashboards*`
and
- Subdomain: `grafana`
- Domain: `<YOUR-DOMAIN>.com`
- Path: `api/public*`
Scroll down to the bottom and click Next to proceed to the Policies section.
Add a policy with the following:
Policy name: Bypass
Action: Bypass
Session Duration: Same as application session timeout

Scroll down and

Configure rules:
Include: Everyone
Value: Everyone (will fill in automatically)
Super, now you've set up all your Cloudflare Applications and Policies. The "gates" are setup, so now we can set up and connect the Cloudflare Tunnel to securely move data between your Pi and the internet.
D. Prepare Your Pi for Cloudflare
In the Pi terminal, install Cloudflare Tunnel. It's good practice when you're adding anything to your Pi to kick things off with a system update:
sudo apt update && sudo apt upgrade -y
Now that the Pi is cleaned & ready, download the Cloudflare binary to the Pi. I'm running a Pi 4B with 64-bit ARM architecture (use uname -m to check yours if you're unsure), so here's the command I'm using:
wget https://github.com/cloudflare/cloudflared/releases/latest/download/cloudflared-linux-arm64 -O cloudflared
That may take a few minutes depending on your connection speed.
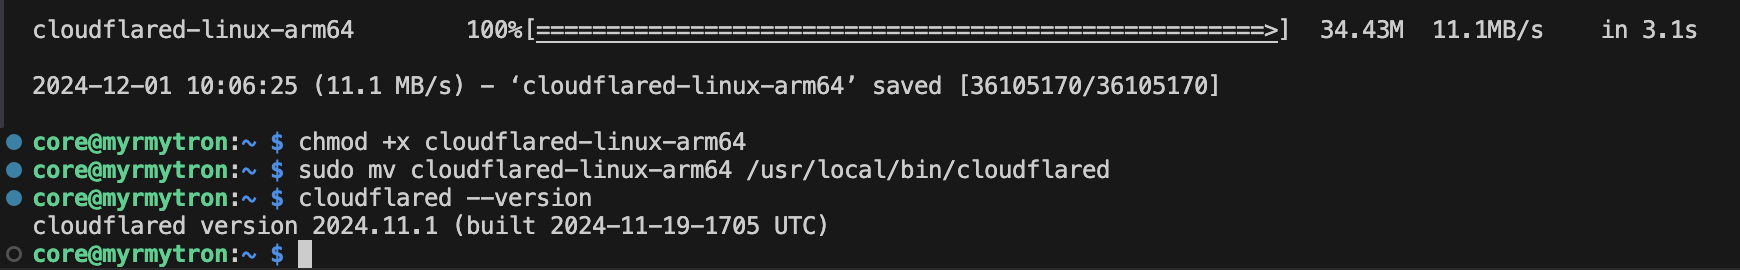
When it's done, let's do a few nerdy things (making the binary executable, moving it to a system path, then verifying the installation).
Make it executable:
chmod +x cloudflared
Move it to a system directory:
sudo mv cloudflared /usr/local/bin/cloudflared
Verify the installation:
cloudflared --version
That should get you here on your Pi:
E. Create a Tunnel In Cloudflare Zero Trust
With Cloudflare's Zero Trust on and our Pi set up, we're going to set up the actual tunnel.
Back in your Cloudflare account, in Zero Trust, go to Networks --> Tunnels --> Add a tunnel.
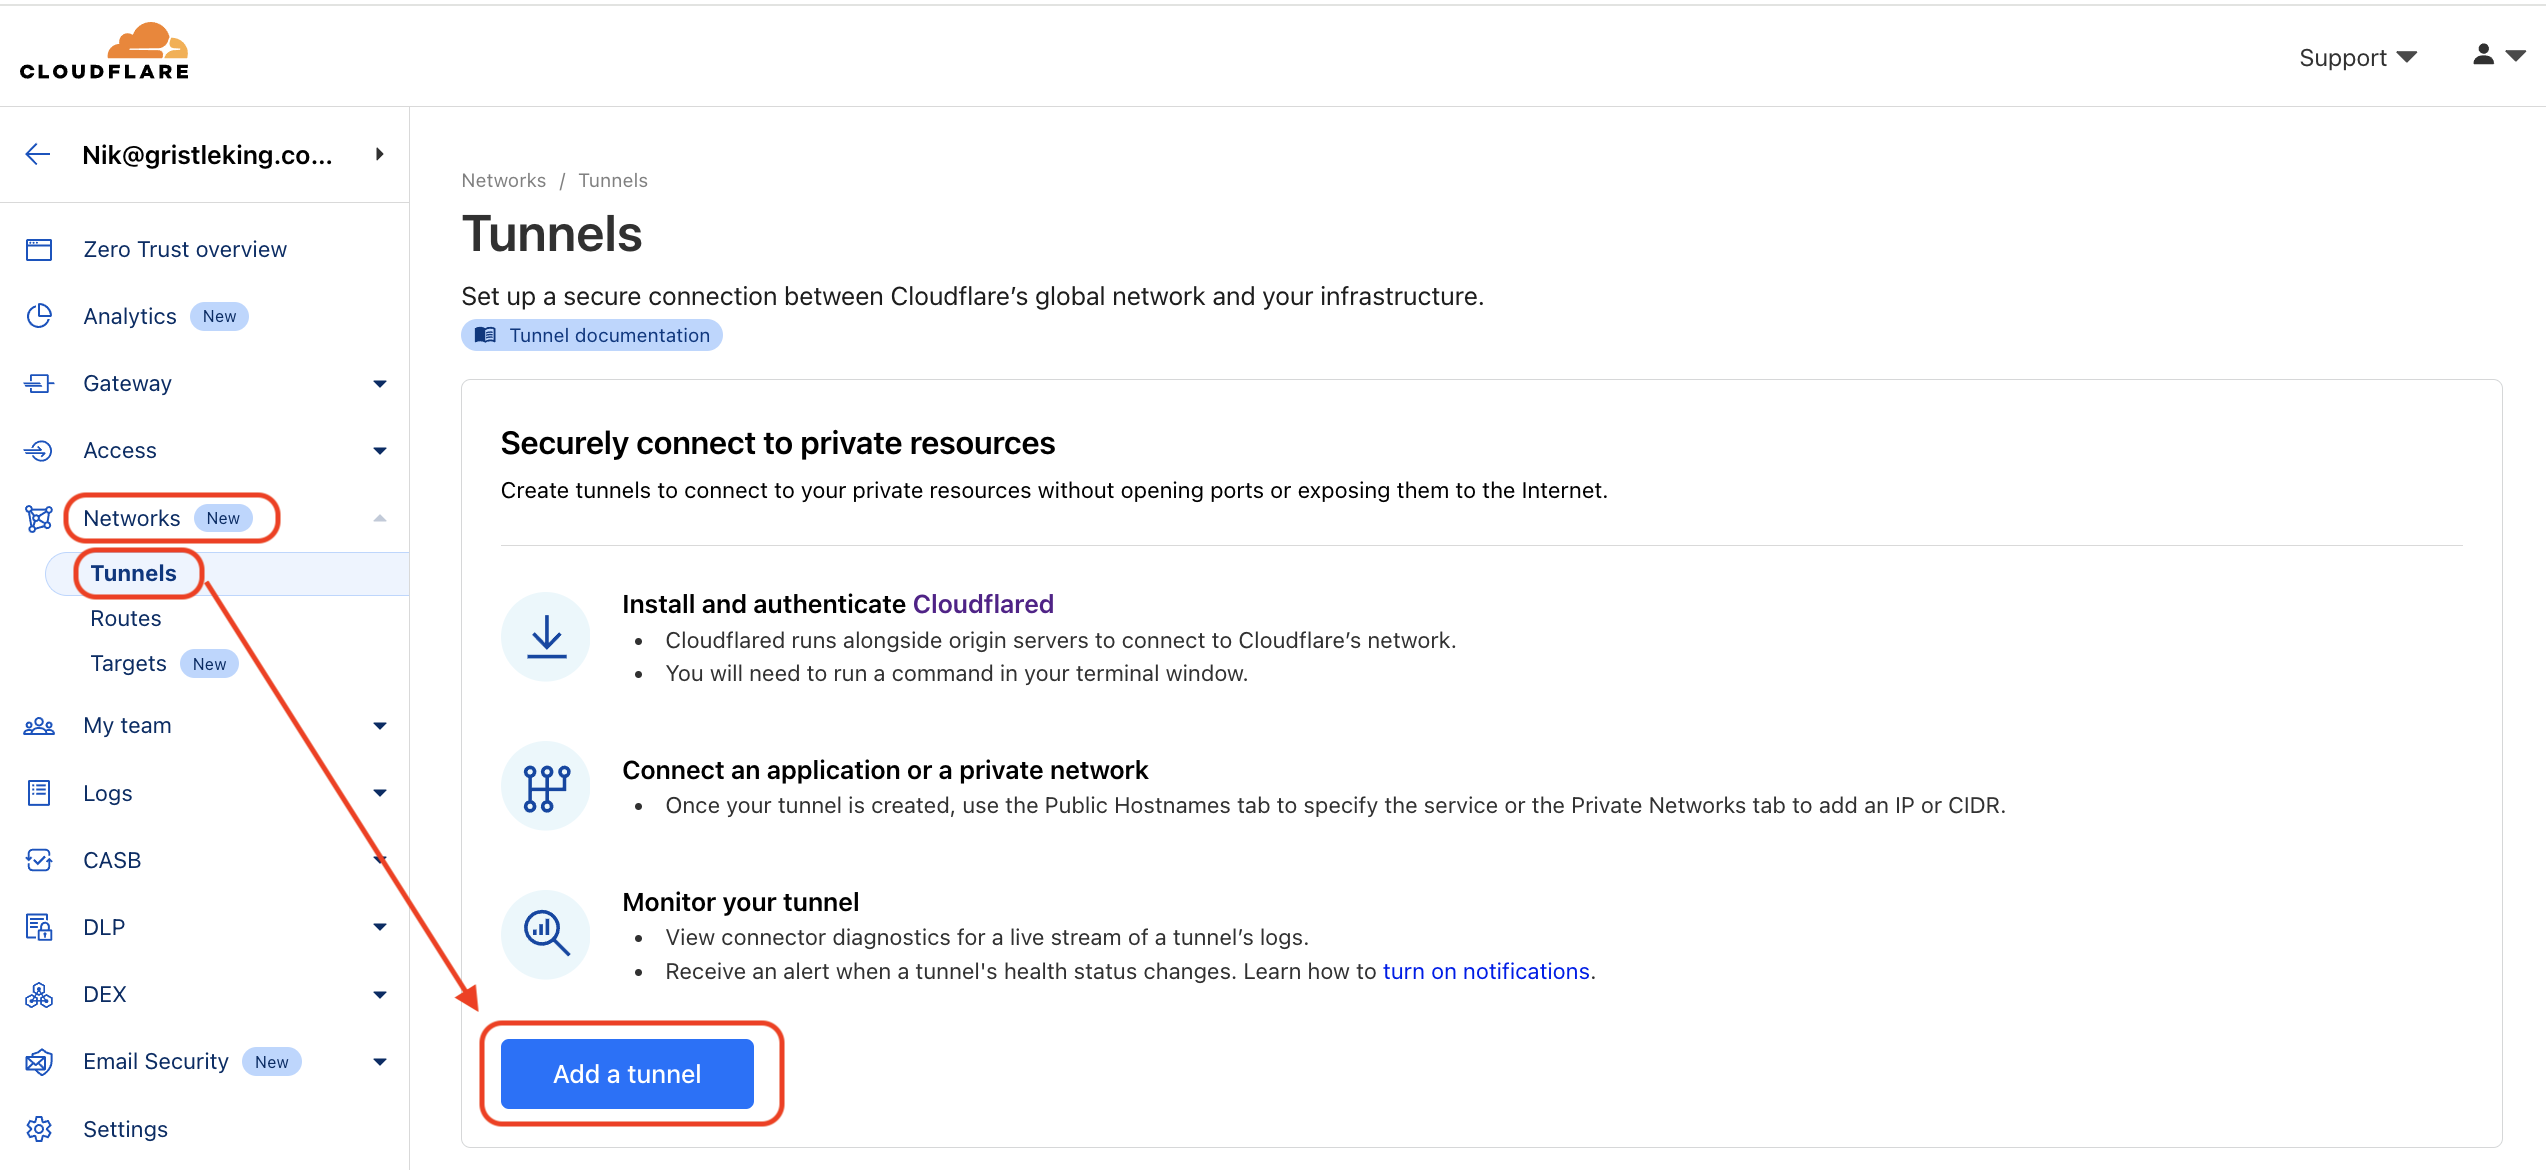
On the next page (not shown here), select Cloudflared, NOT WARP Connector, then choose a tunnel name. I'll use metsci-demo for mine.
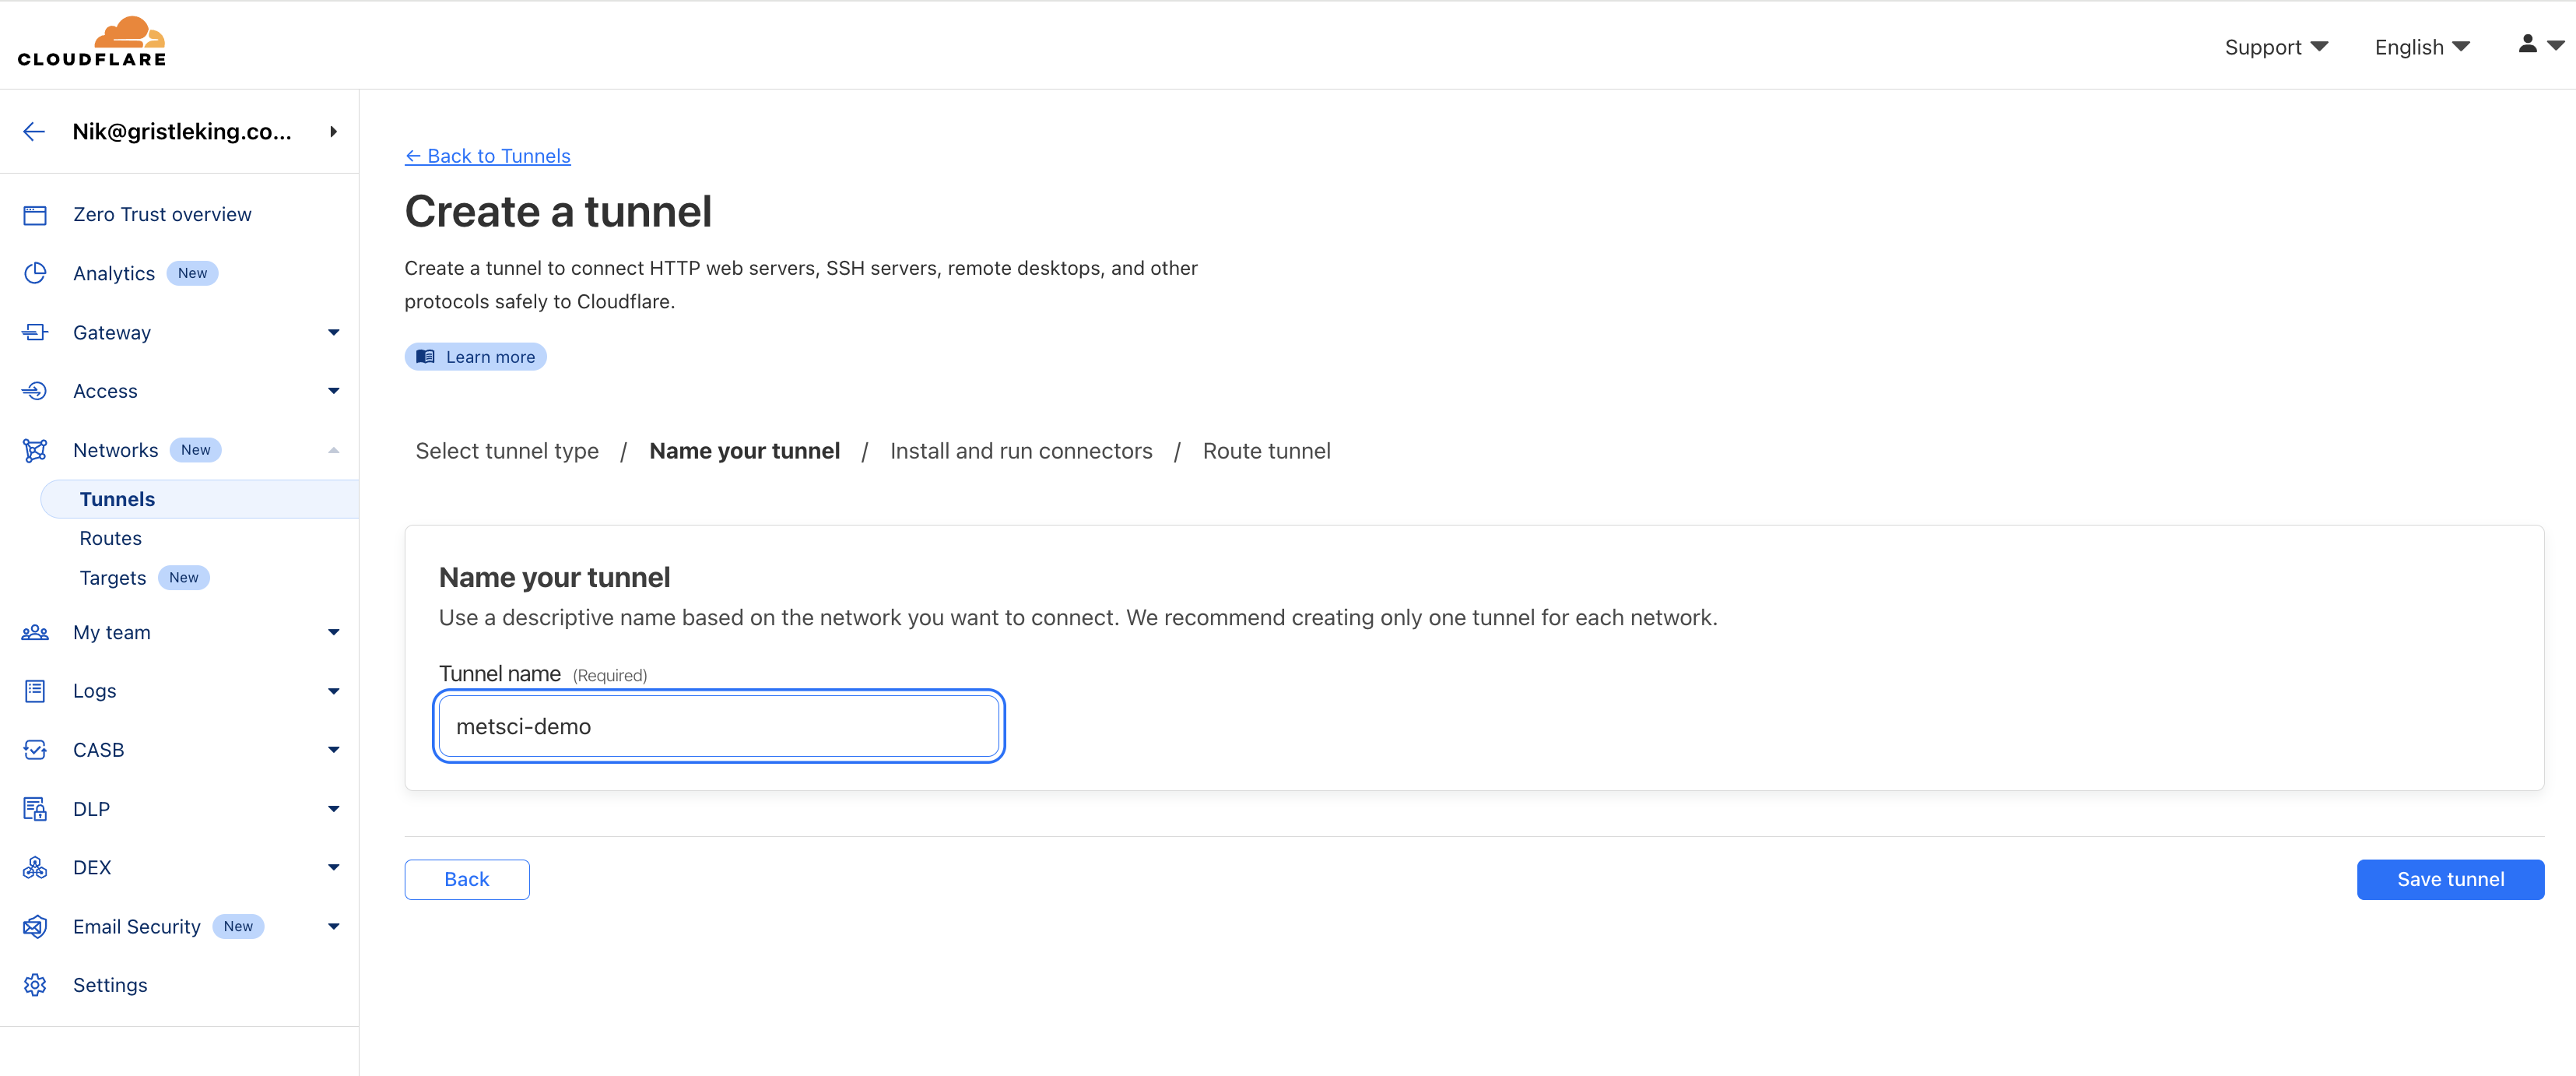
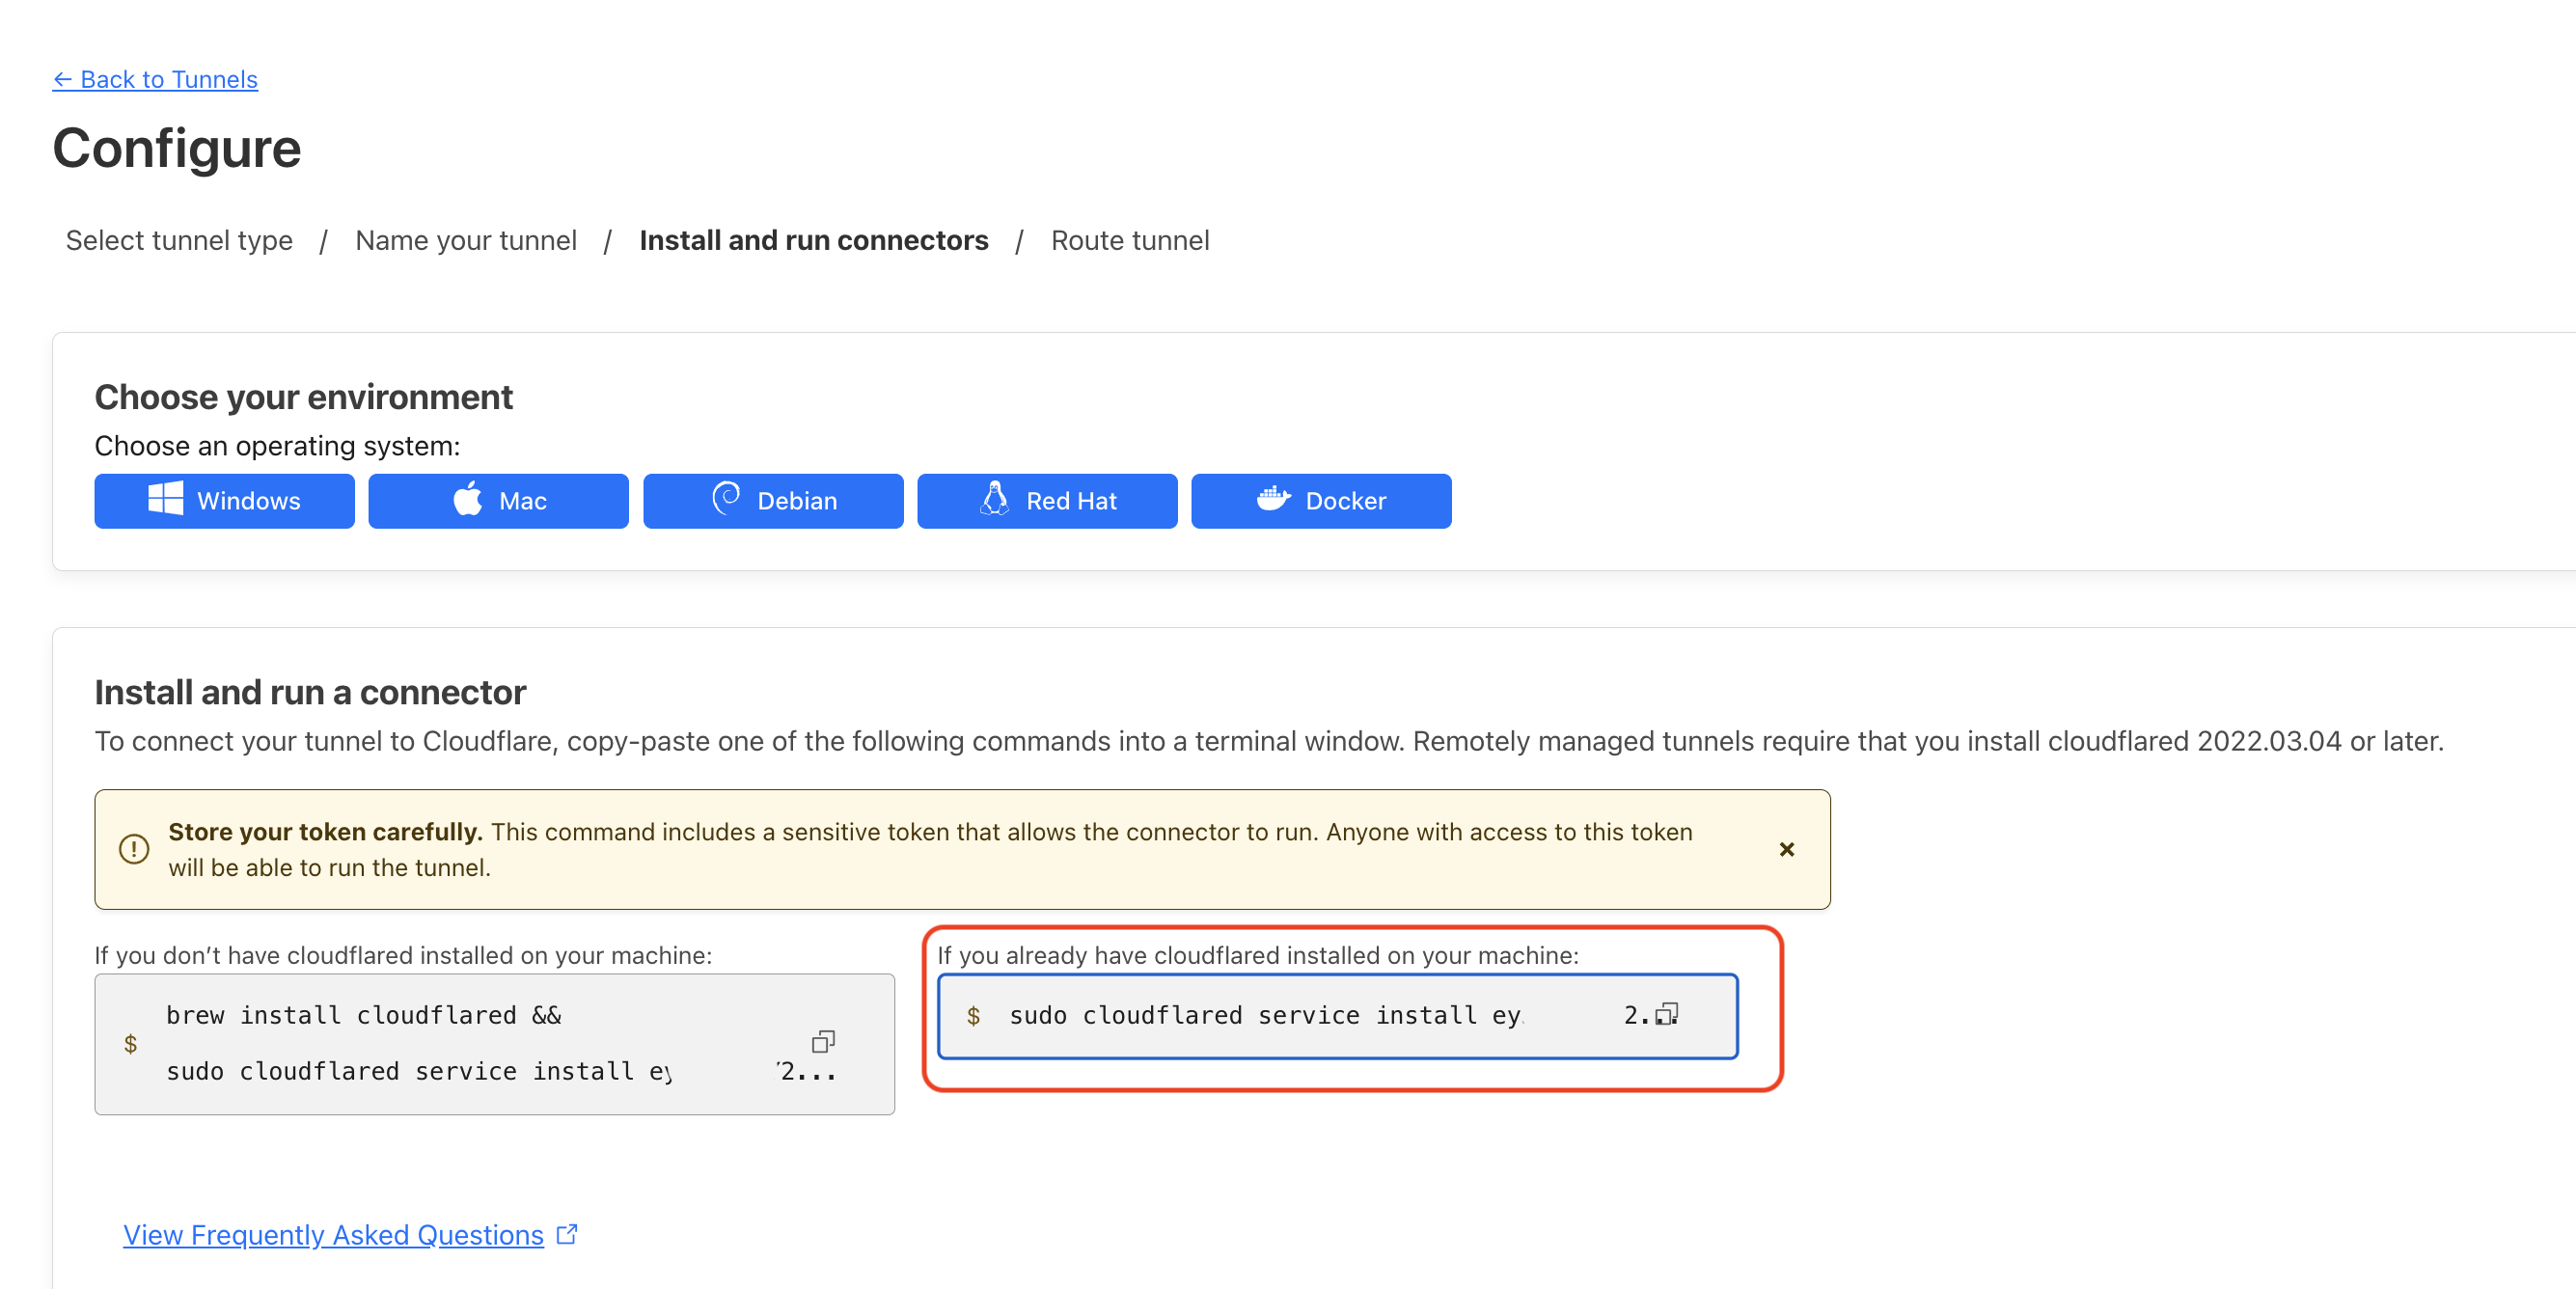
Save the tunnel and you'll be taken to the Configure page. Look for the Install and Run Connector section and copy the command on the right.
F. Add The Tunnel To Your Raspberry Pi
Back on your Pi, run the command they gave us:
sudo cloudflared service install super-duper-alpha-numeric-string
You should see a success message, like this.
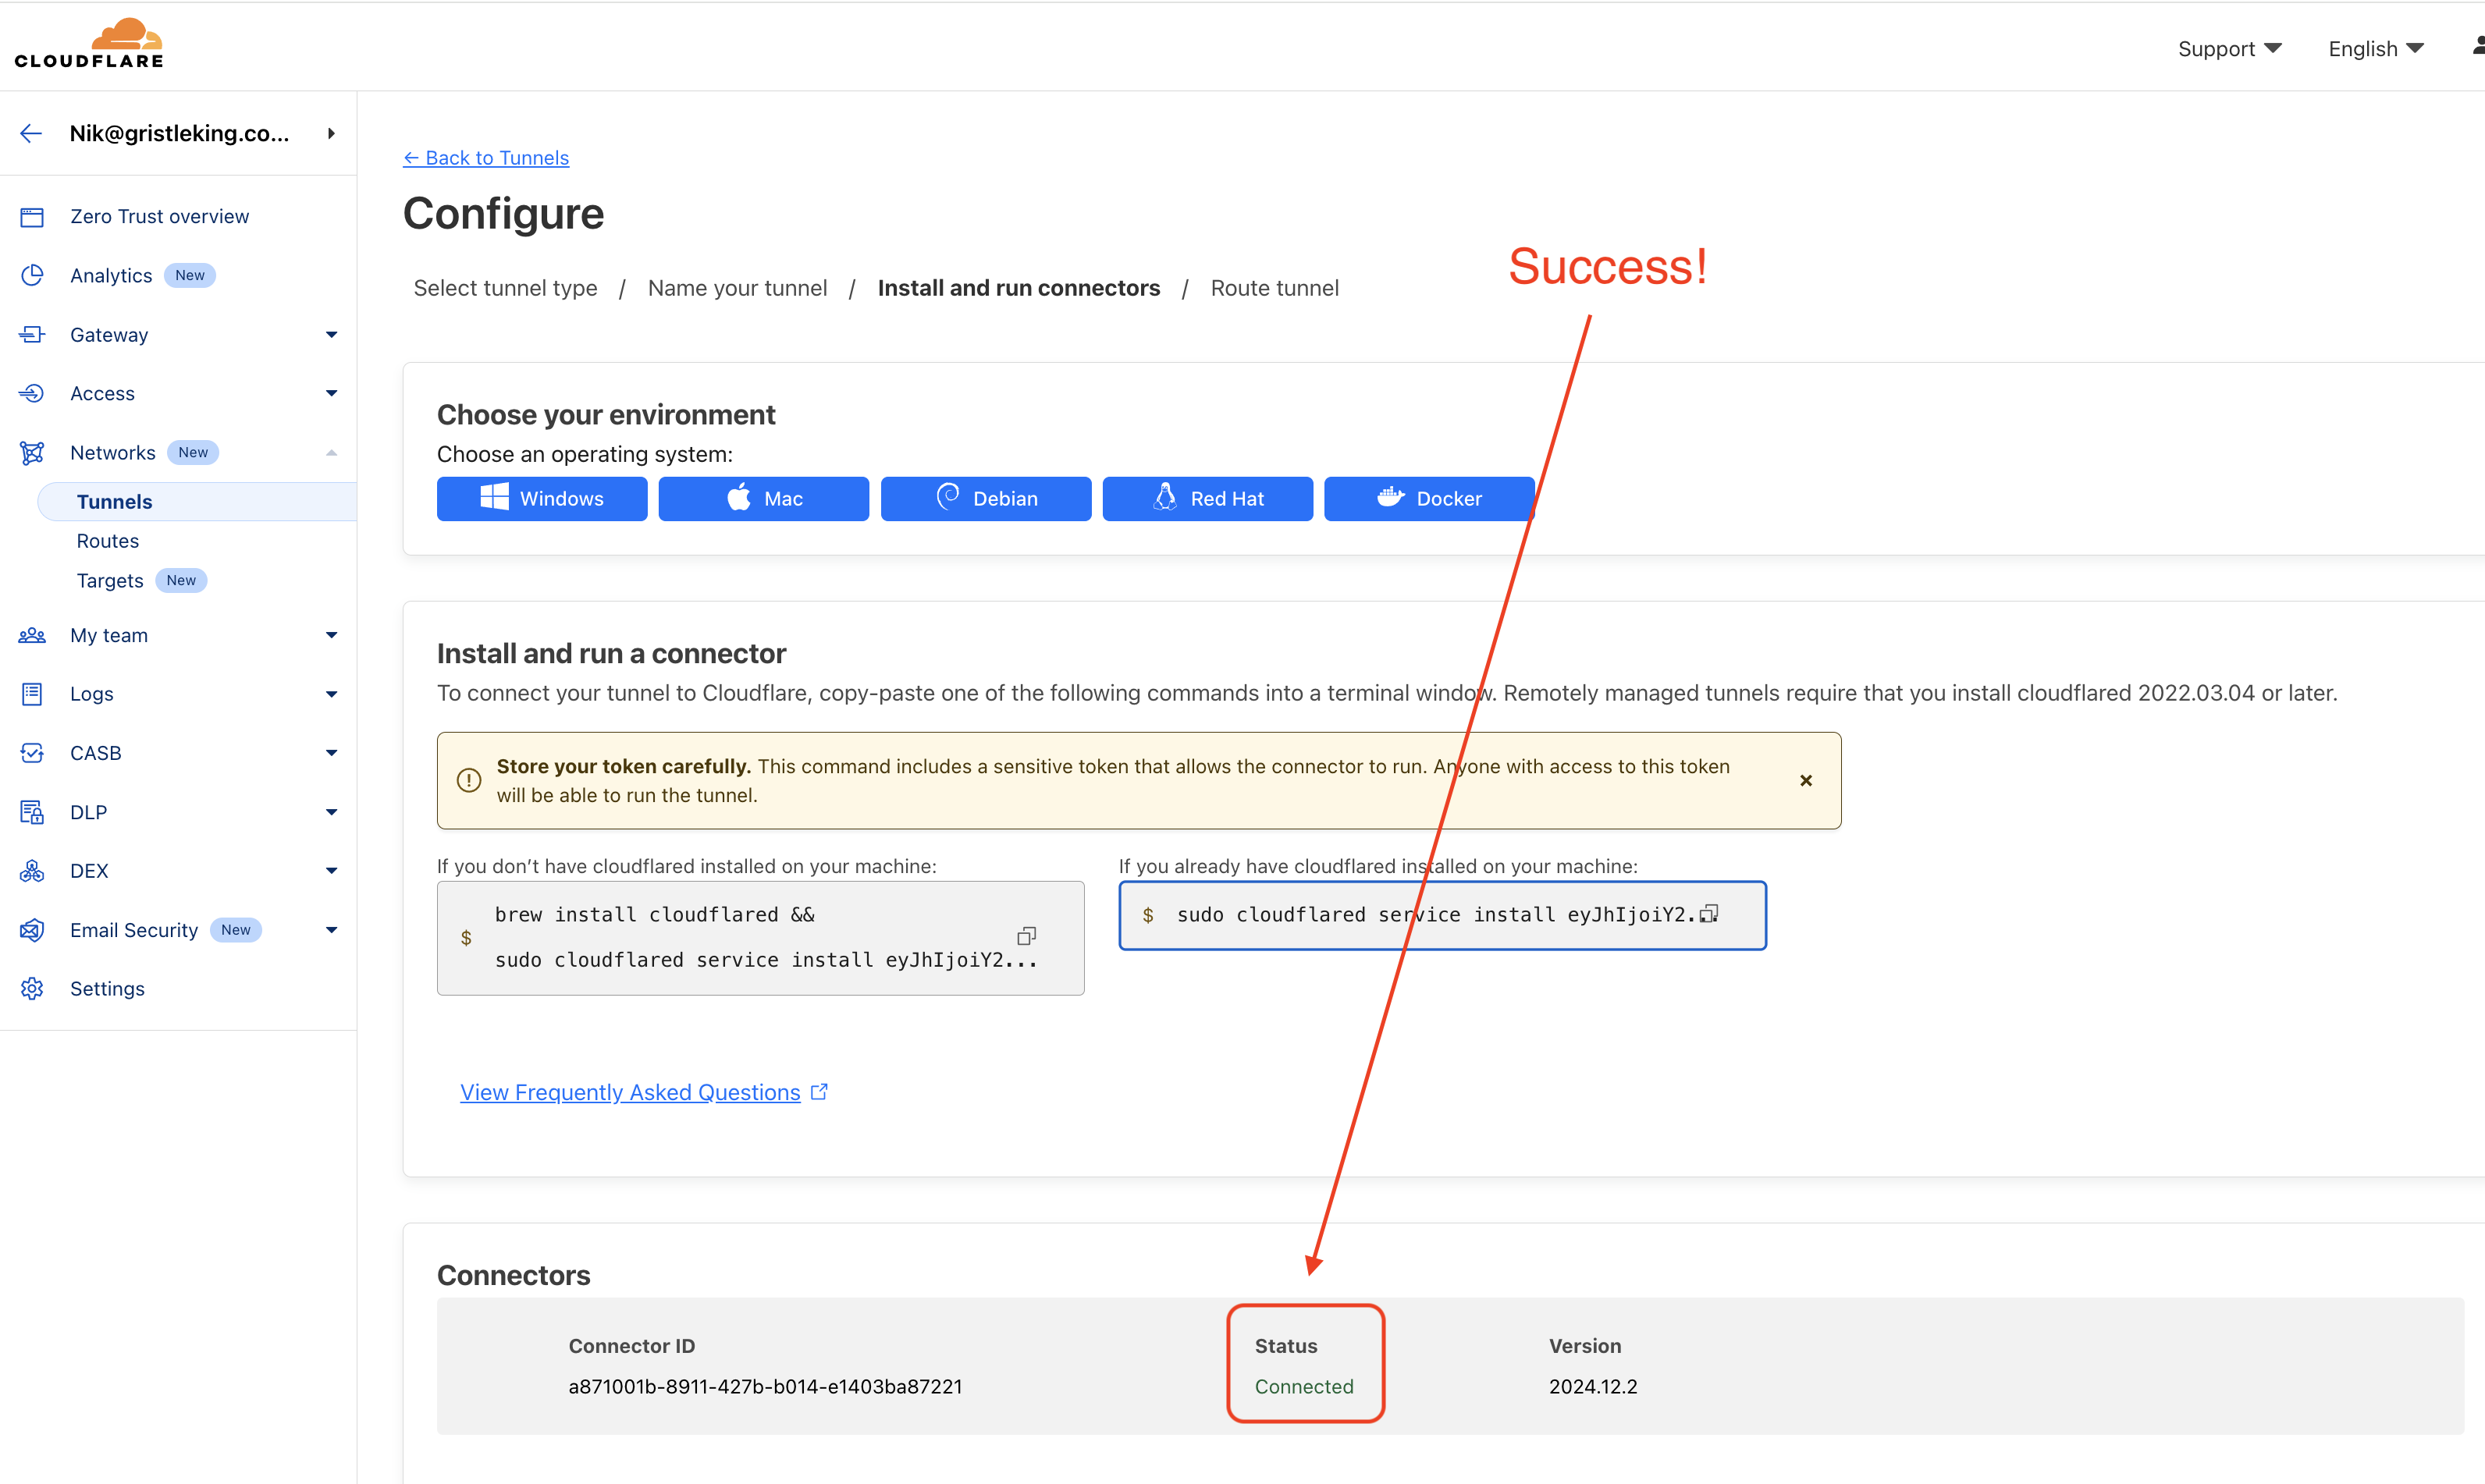
Hit Next at the bottom right of your Cloudflare Configure tunnel screen.
G. Setting Up Public Hostnames
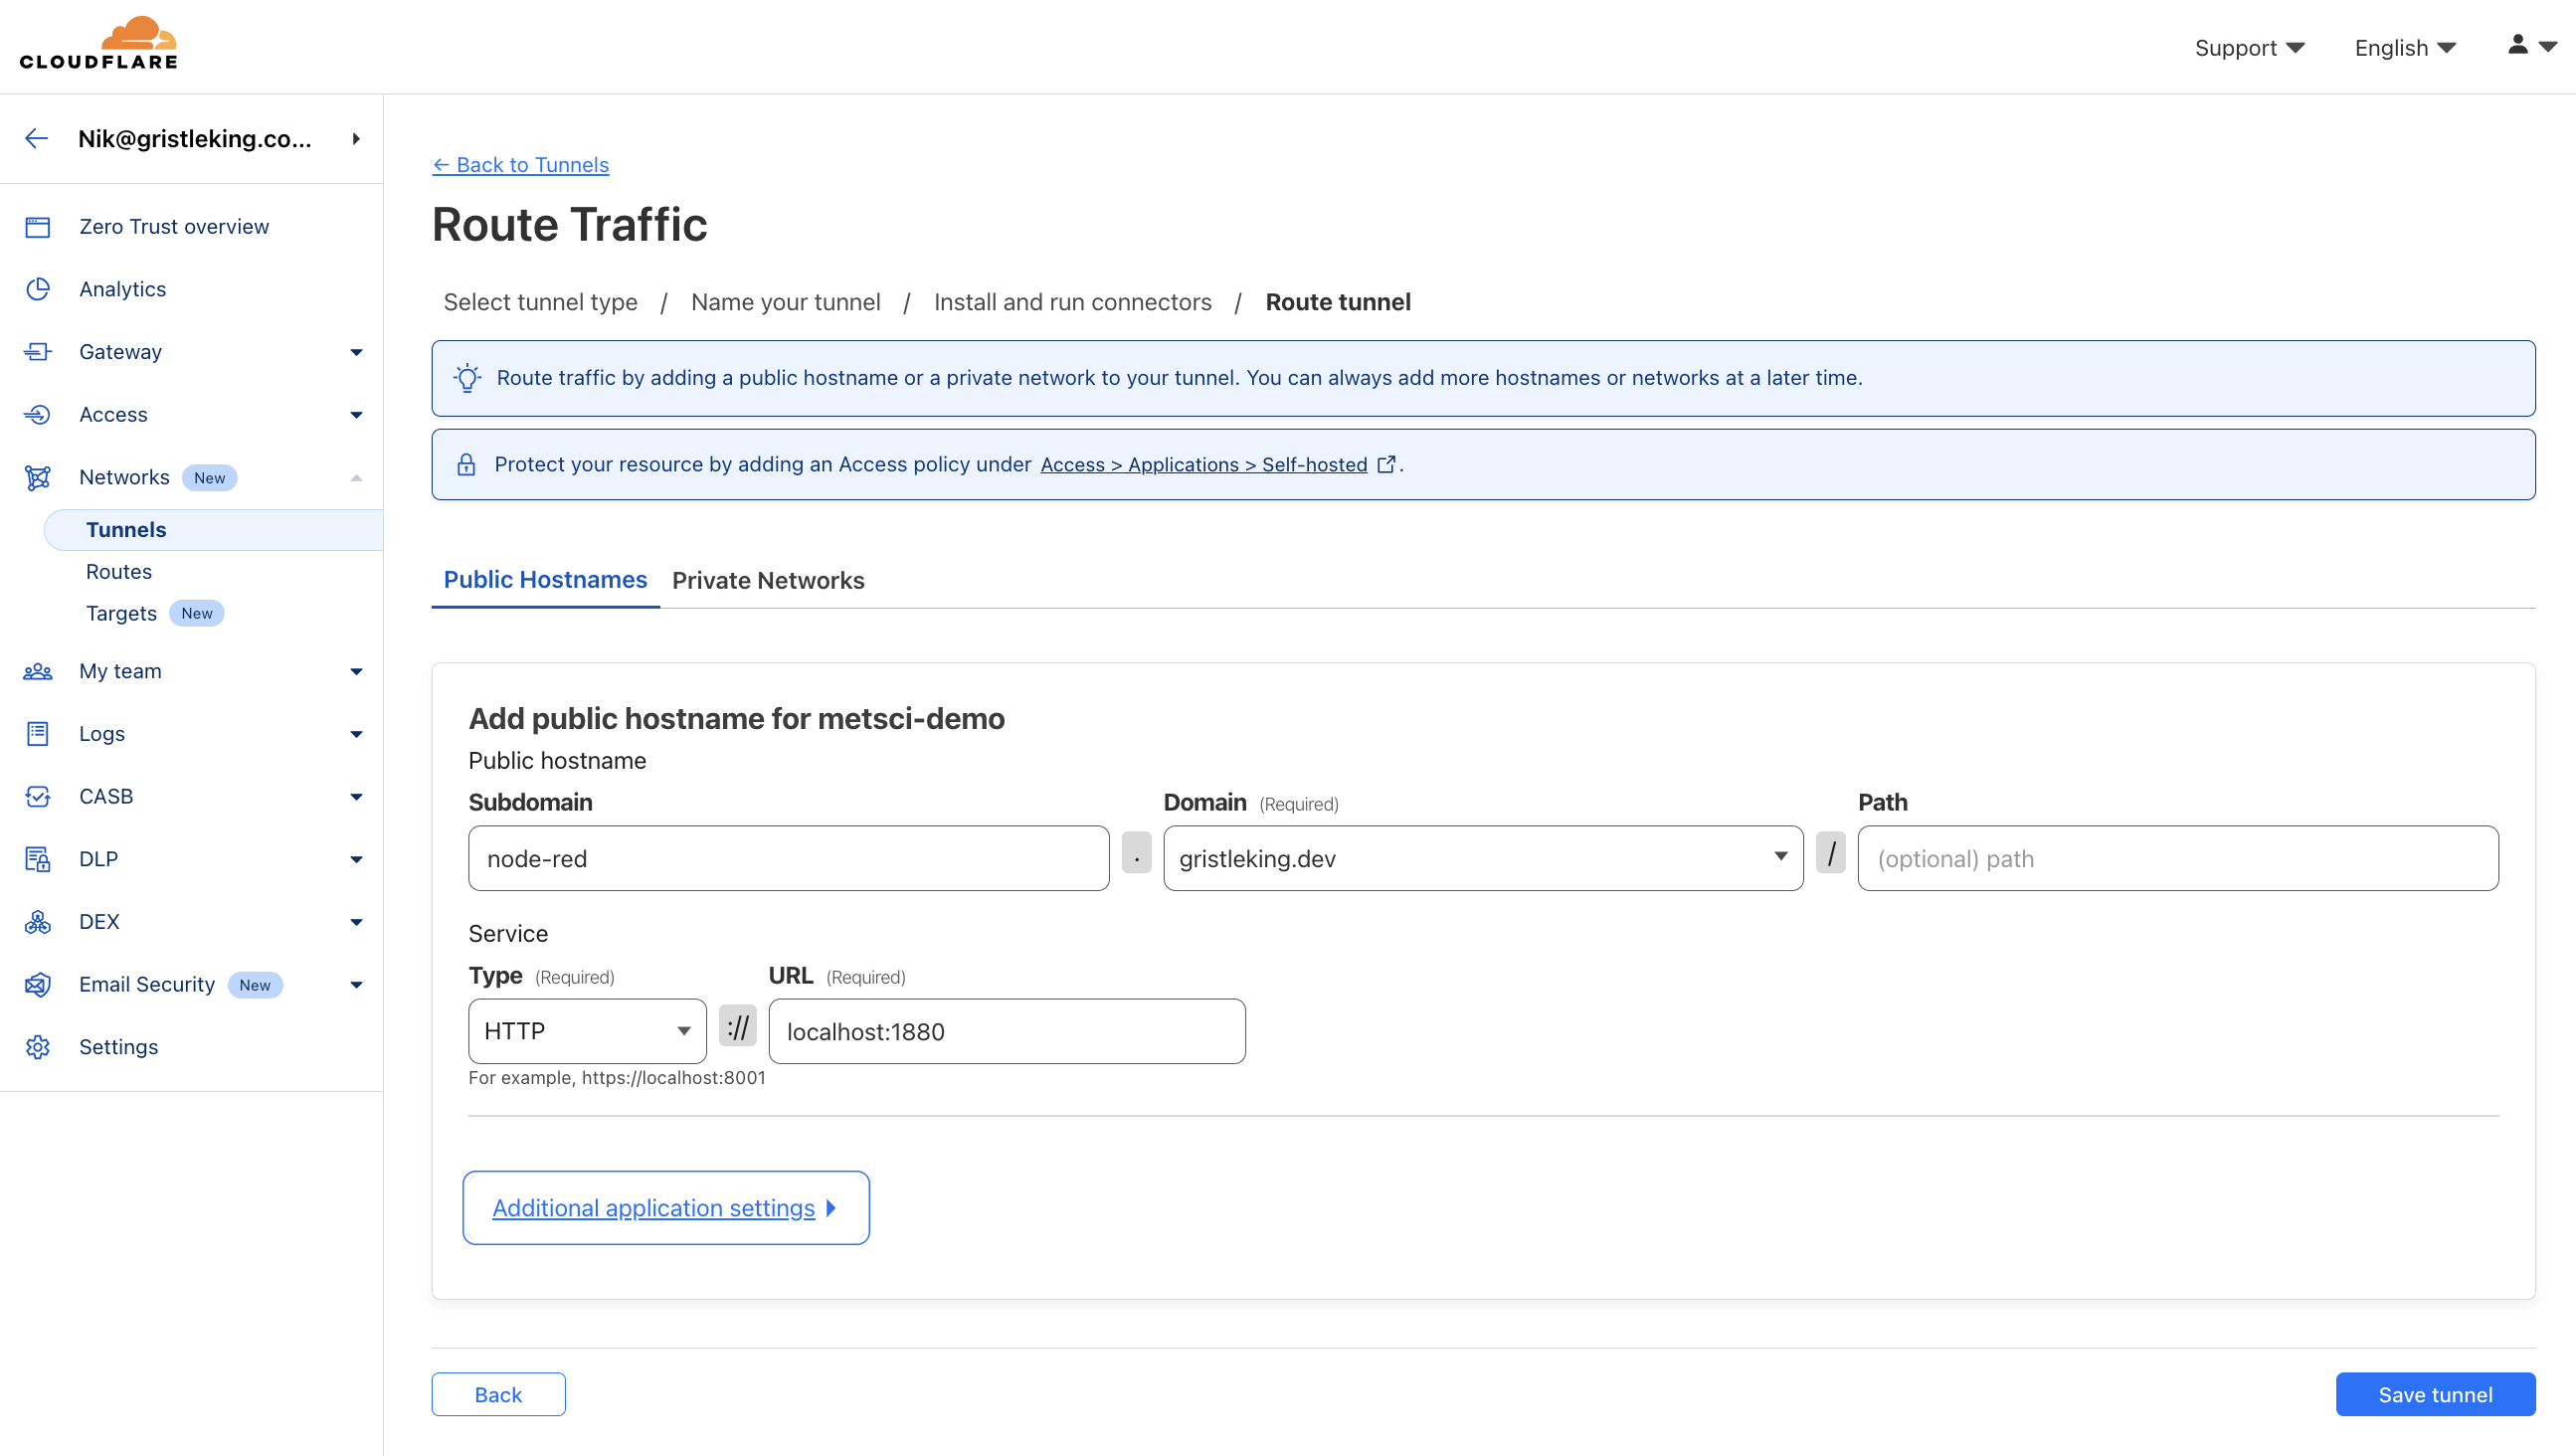
With our tunnel set up, now we'll create our Public Hostnames (subdomains), starting with Node-RED.
1. Node-RED Subdomain
Add node-red in the Subdomain field, then choose your domain. I'm using gristleking.dev for this tutorial. Throughout the tutorial, wherever you see gristleking.dev, replace it with your own domain.
For Type choose HTTP, then set the URL to localhost:1880, which is the port Node-RED runs on.
Now hit the blue Save tunnel button at the bottom right.
You'll be taken back to the Tunnels page. Click on the three stacked dots on the right side of the row for your tunnel, then click Configure.
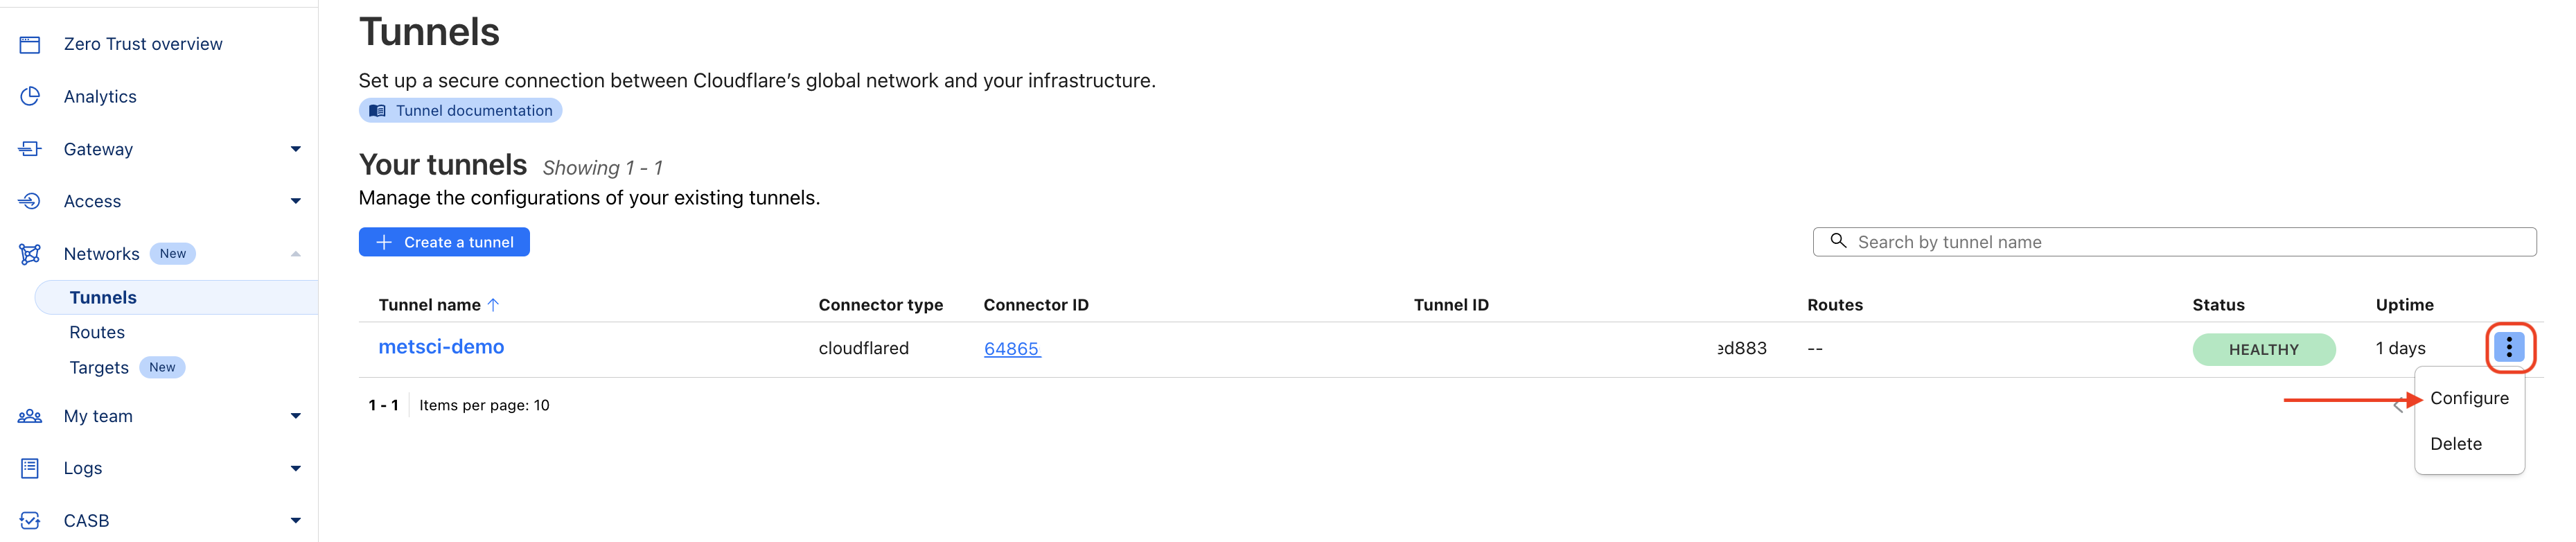
Now we'll set up the Grafana public hostname.
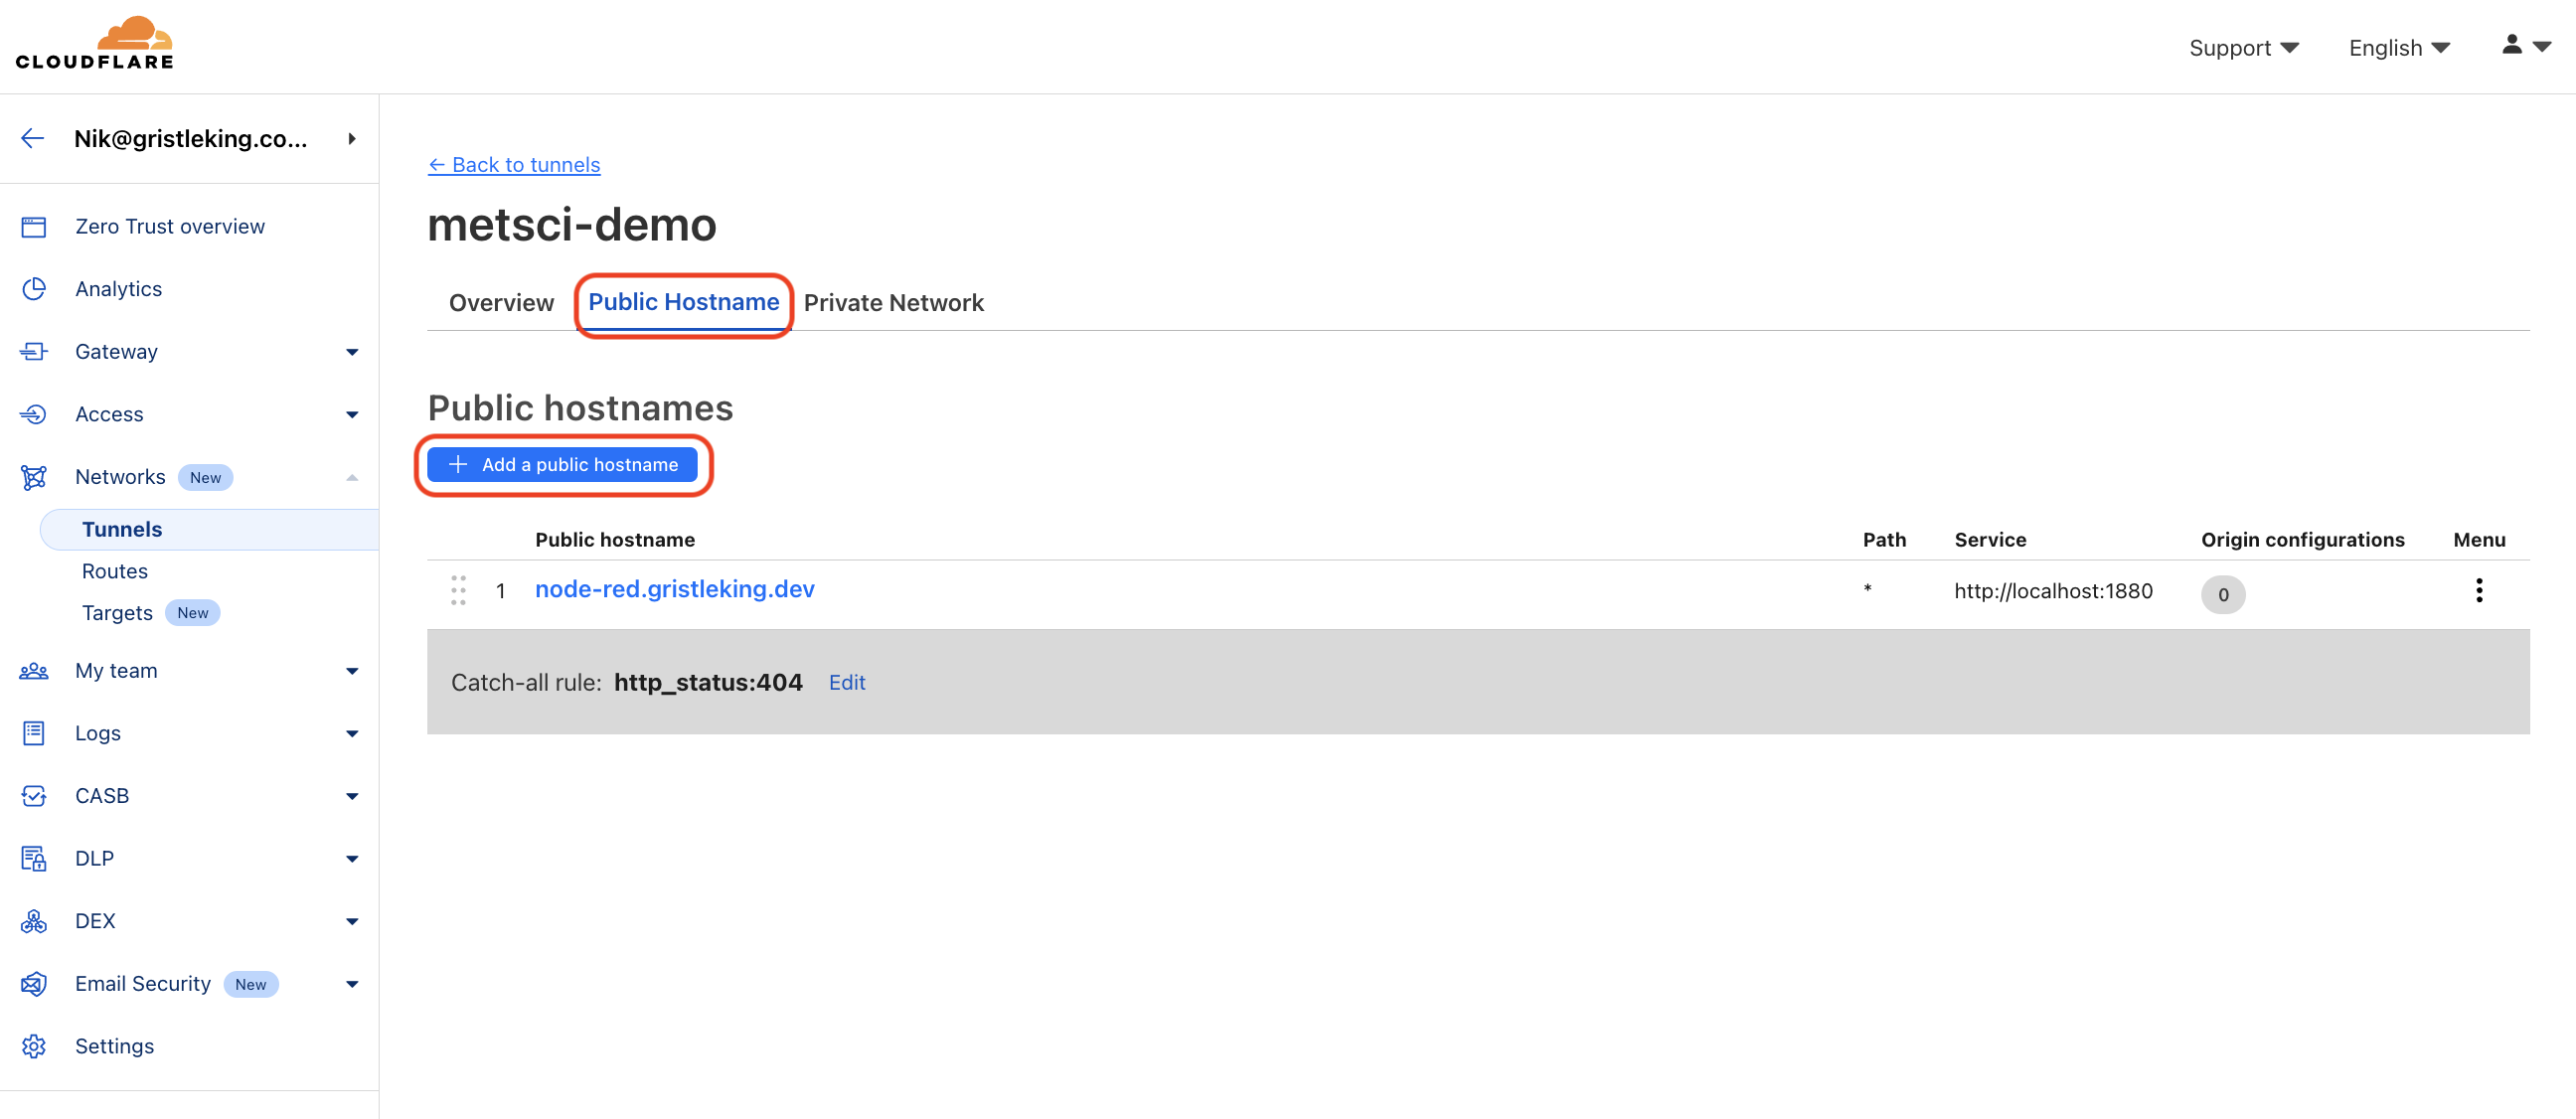
2. Grafana Subdomain
Select Public Hostname and click Add a public hostname.
Set it up the same way you did for Ned-RED, just subbing in grafana and the correct port as follows:
-Subdomain: grafana
-Domain: <YOUR-DOMAIN>.com
-Type: HTTP
-URL: localhost:3000
It should look like this:
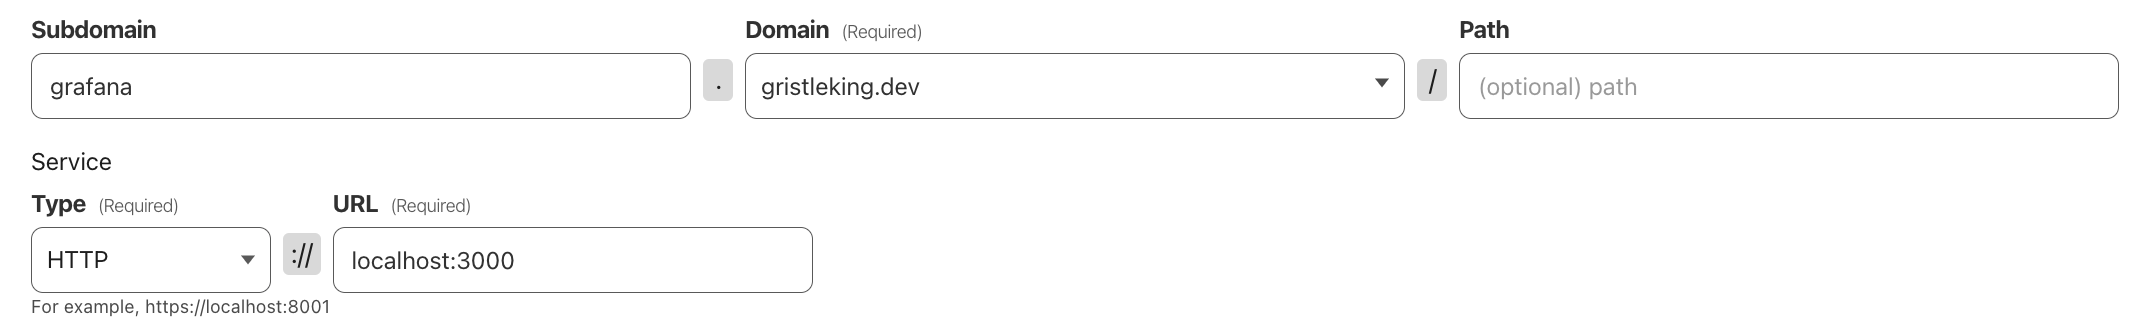
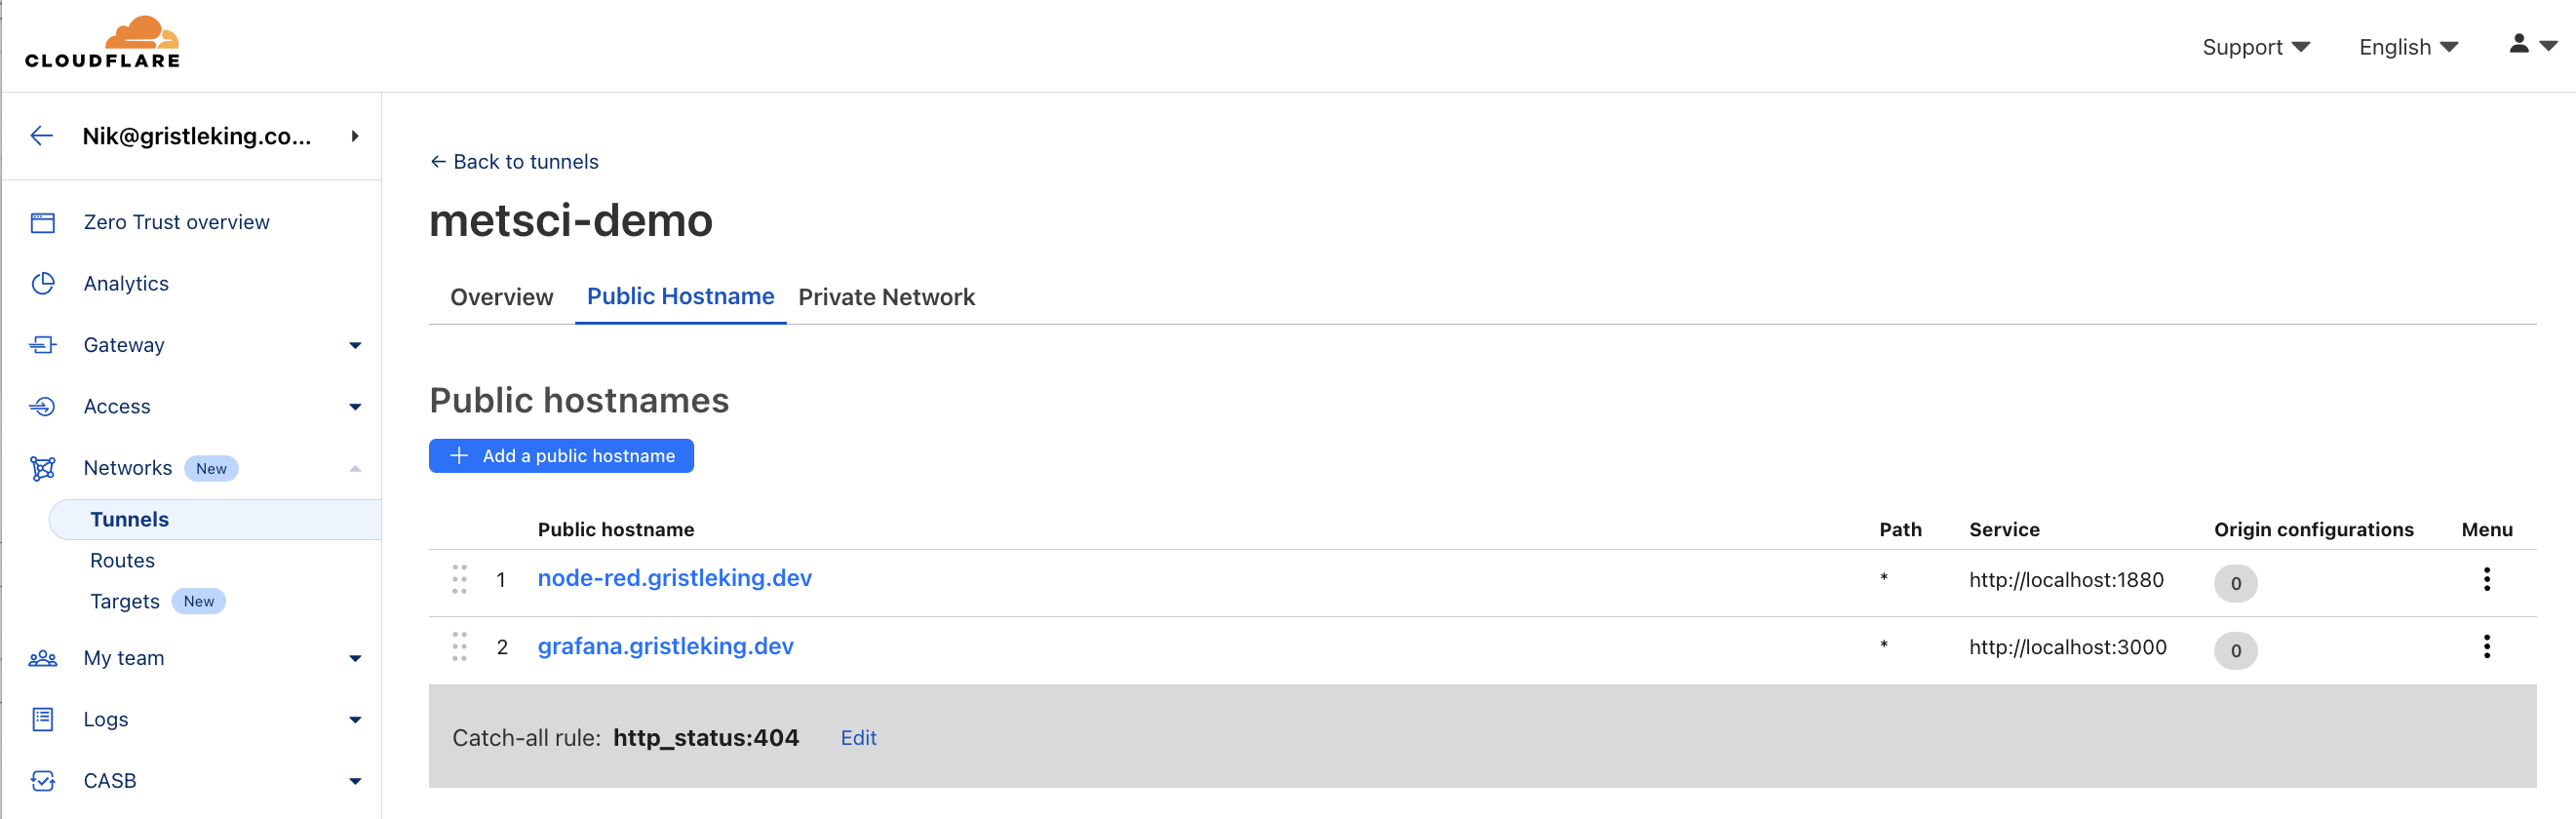
Click Save hostname.
You can now see both your public hostnames for your tunnel. Cool, right?
H. Document Your Public Hostnames
Head back to the Cloudflare main menu and choose your domain, then DNS, then look for the subdomain you just set up. I usually add a note to mine, something like this is for Node-RED for the MetSci Demo Dash project, just so future me has a clue as to what's going on.
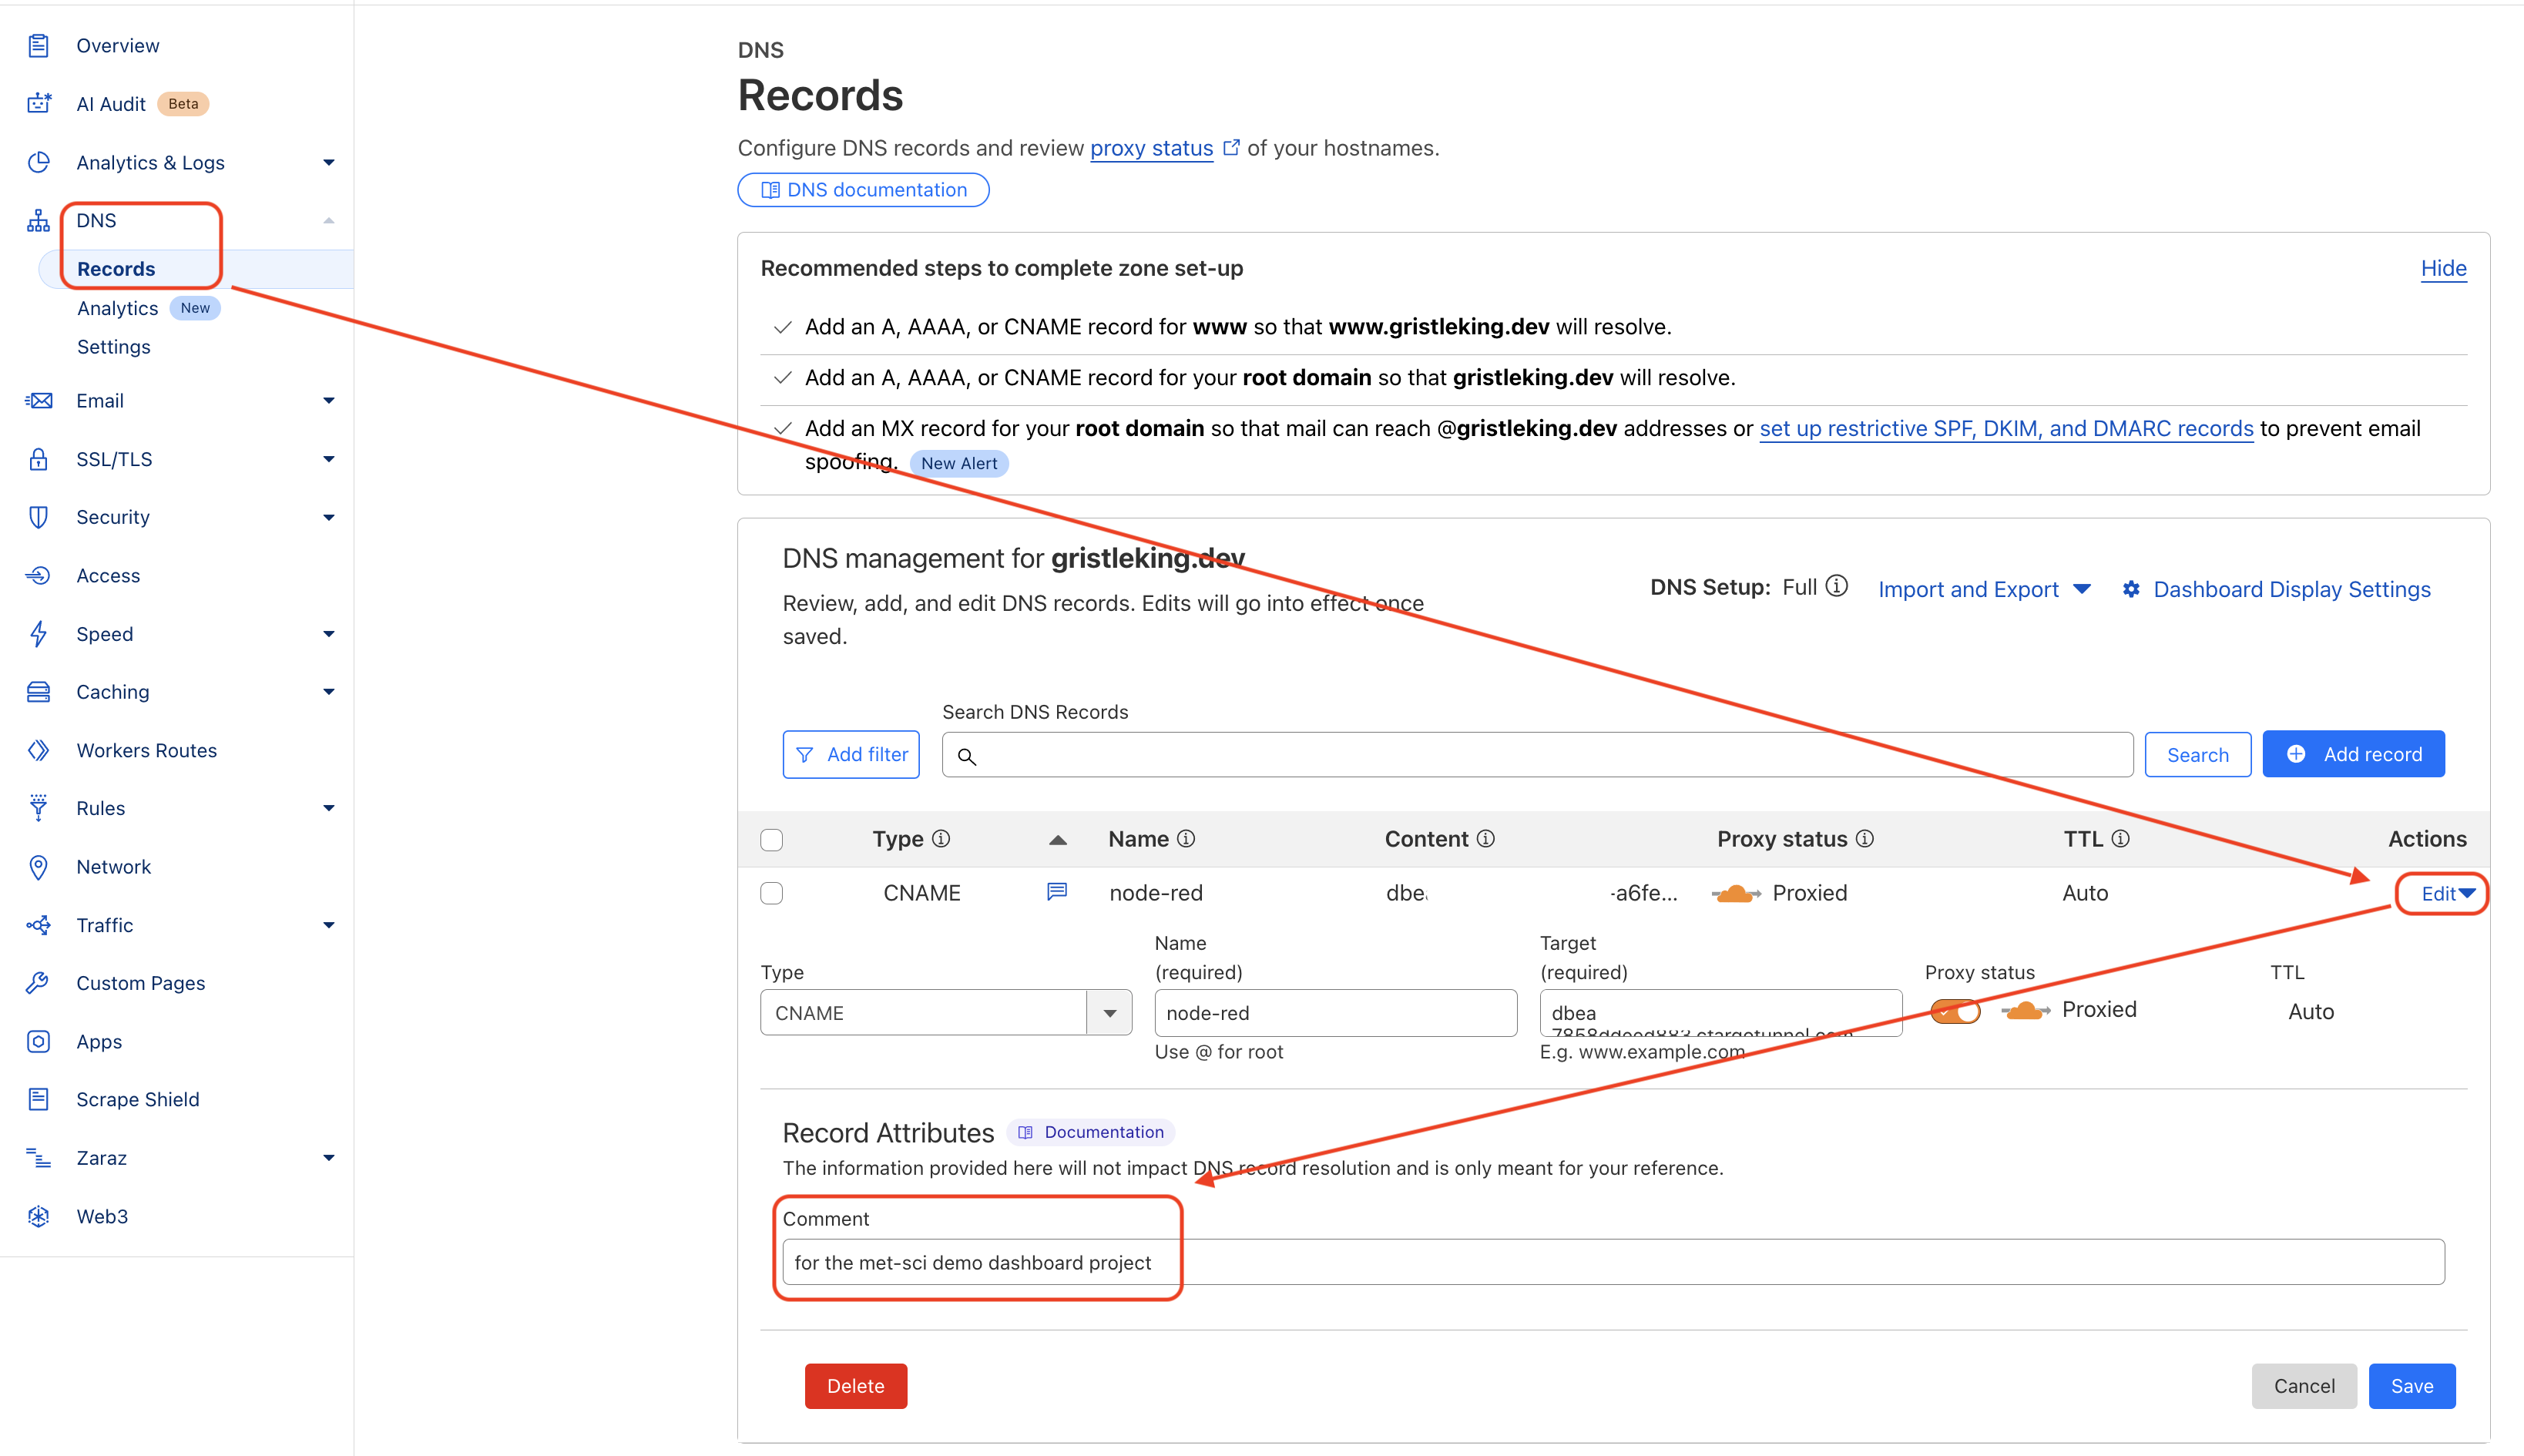
Now you've set it up so that you can share a dashboard via your Cloudflare tunnel, but the rest of your Grafana instance is still protected. Big thanks to Chaika over on the Cloudflare Discord for walking me through the Grafana dashboard setup!
5. Setting Up Your LDDS 75 Sensor
Whether this is your first device ever or your 100th, now is a good time to think about how you're going to structure your data. I've written a separate tutorial just on structuring data. If you've never thought about this before, it's a good idea to read through that. You can also just YOLO and follow along, trusting that my data structure is good enough for you.
I'm not going to tell you what to do, but I will tell you that if you're going to be doing anything with your data, you're going to want to think about it.
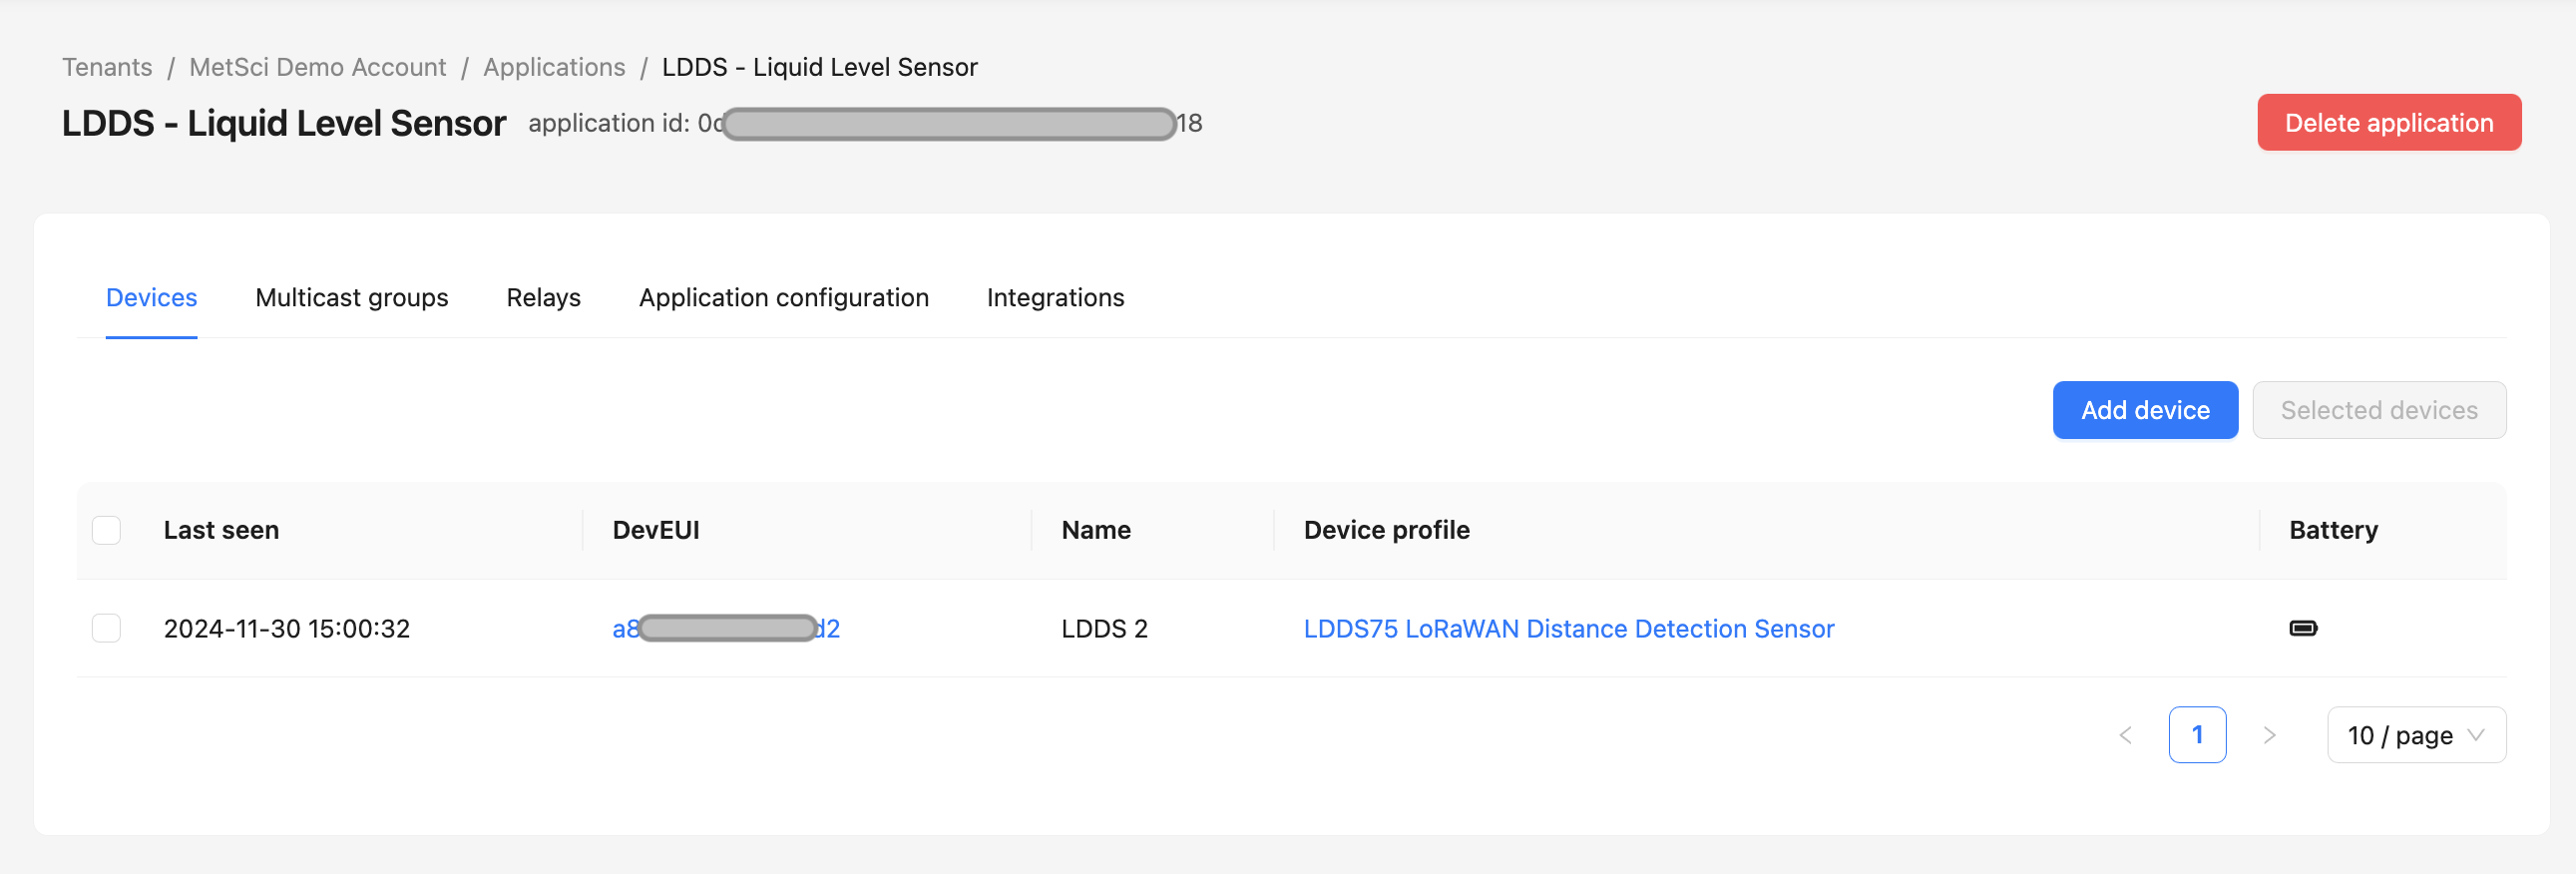
A. Provision That Sucker!
Use the Add A Device tutorial on this site to walk you through it. A working codec for the device is in MetSci already. When you're done, it should look like this:
B. Check Link Metrics
Ok, assuming you've got your data structure set up, after a while (for me this is about 3 weeks) your Link Metrics for the device will be pretty boring flat lines, like this:
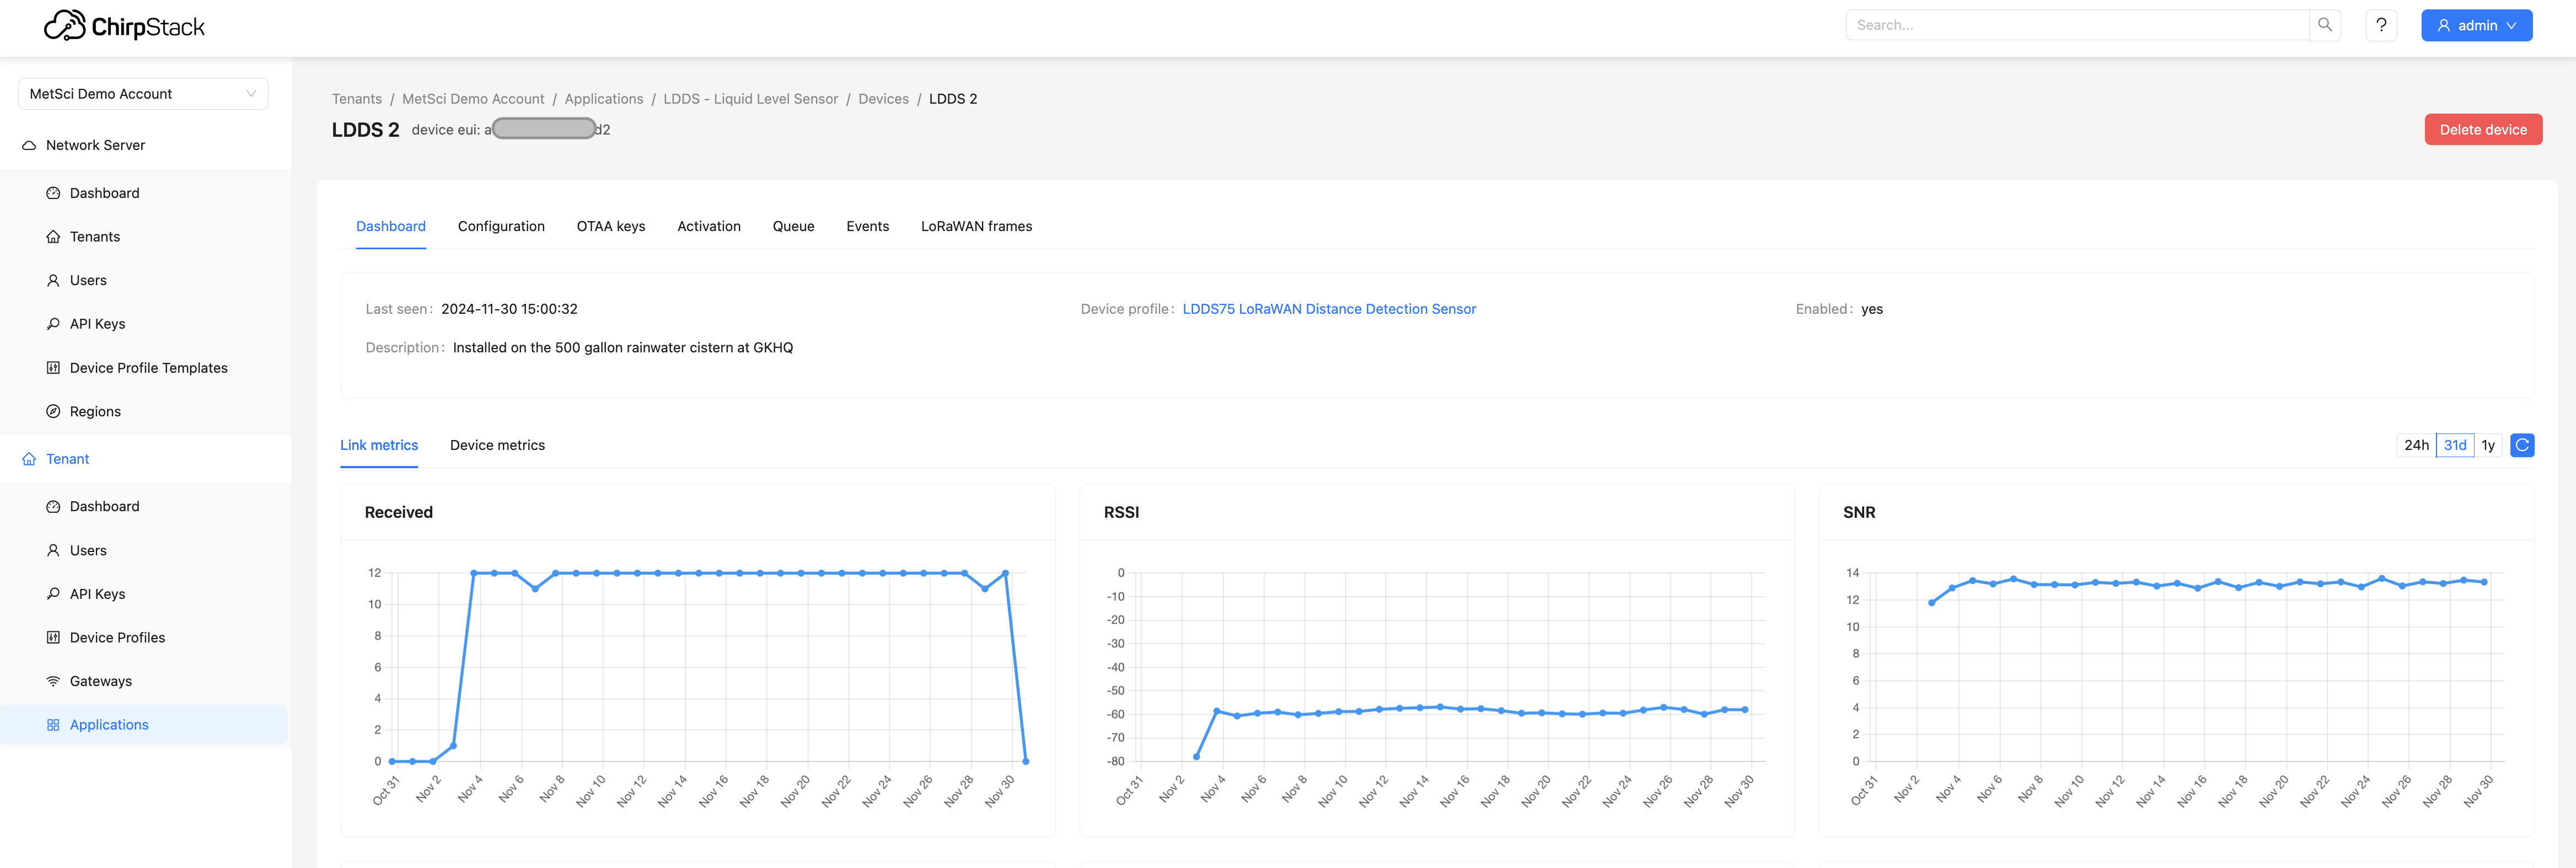
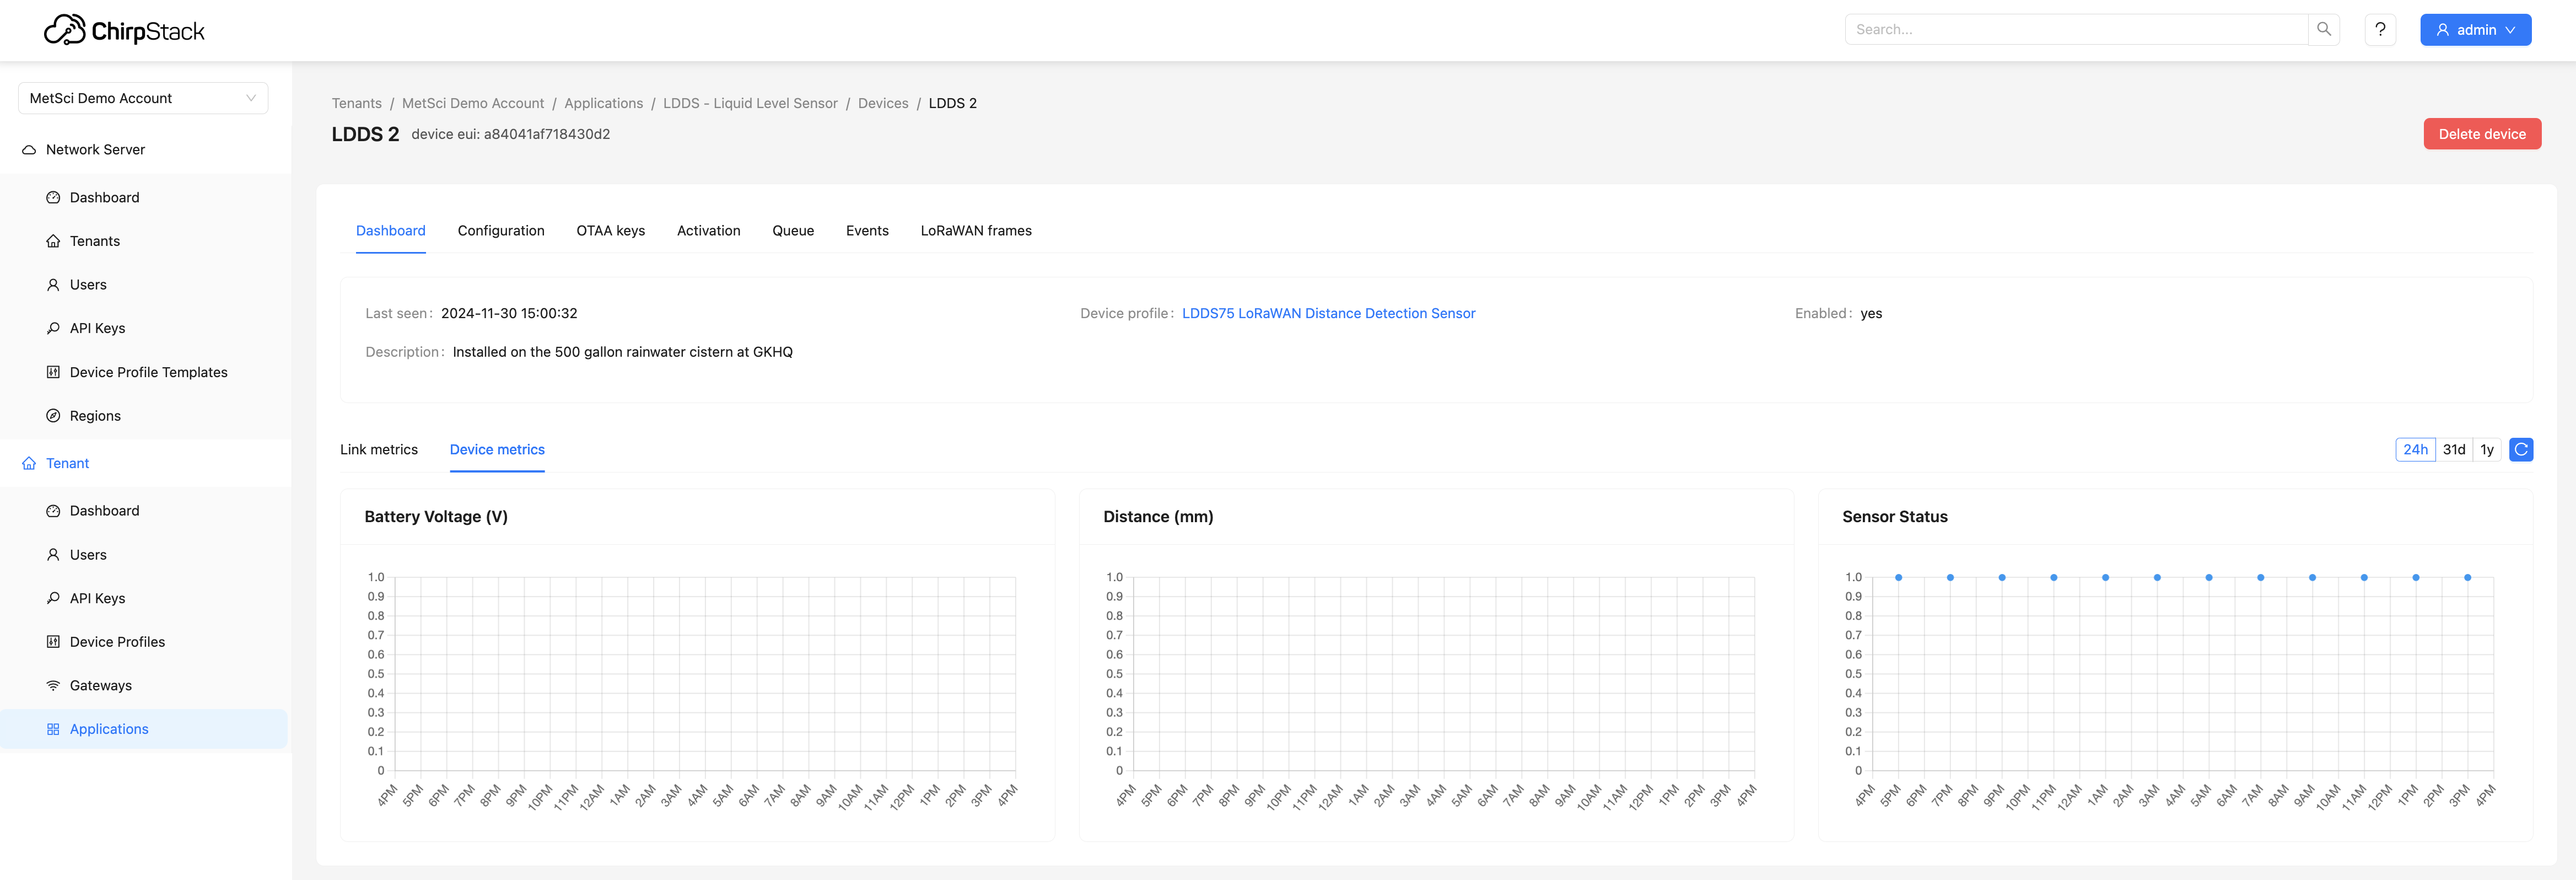
Quick note: You can't see the Device Metrics properly in Chirpstack, which is what we're using for an LNS, as both the Battery Voltage and the Distance will be off the chart, which is 0 - 1.0, and unless you have the optional extra temp sensor you won't see that either. Don't worry about seeing anything here; that's why we're setting up a dashboard. 🔧
C. Configure For Fast Firing
We're going to need some data coming through the tunnel in a bit, so let's set up the LDDS75 to fire every minute for now, then we'll pull the power until we're ready to test.
Use this guide to set up the LDDS75 to fire every minute. You "could" theoretically do all this with downlinks, but A) I'm not covering that here and B) I want you to have the ability to wire into a sensor and tell it what to do.
However you do it...
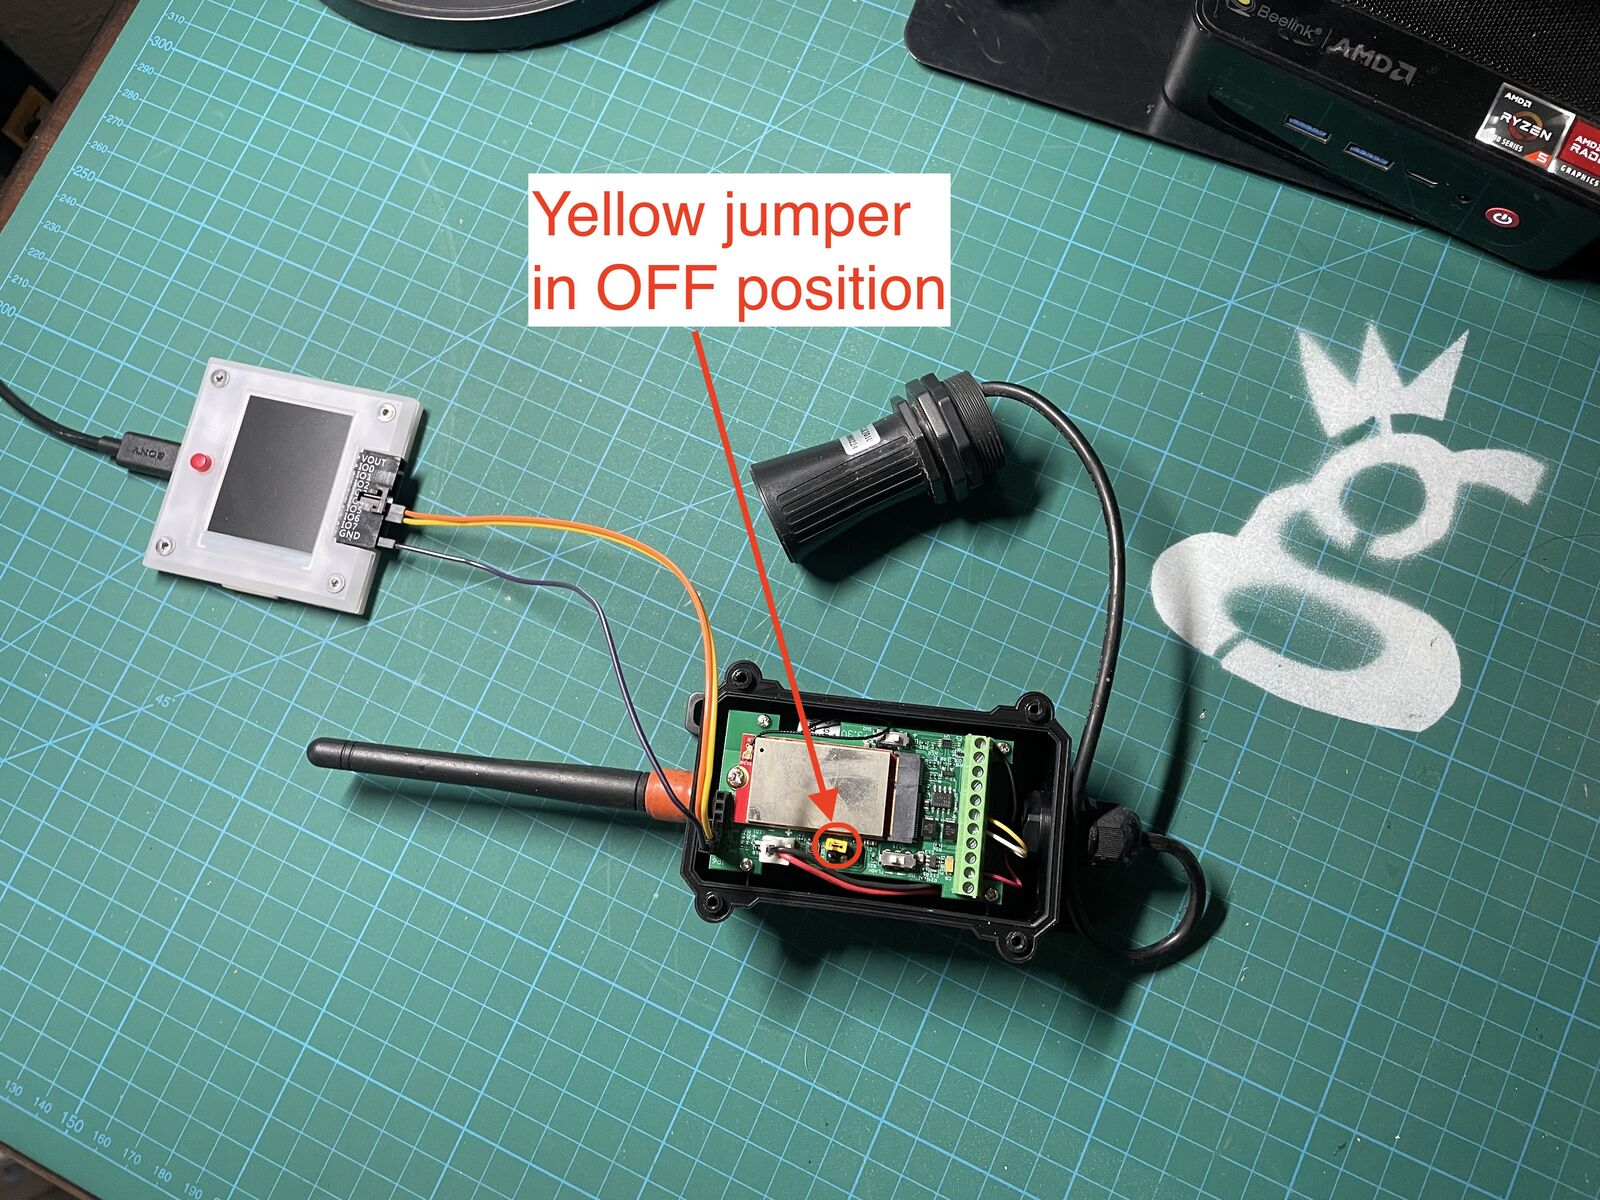
Once you've got it set up and seen a few packets come through, pull the power on your LDDS75 using the yellow jumper; we'll use it again in a bit.
D. Set Up The HTTP Integration In MetSci
Head back over to the MeteoScientific Console and in Applications-->LDDS 75 (or whatever you called it), look for the Integrations tab.
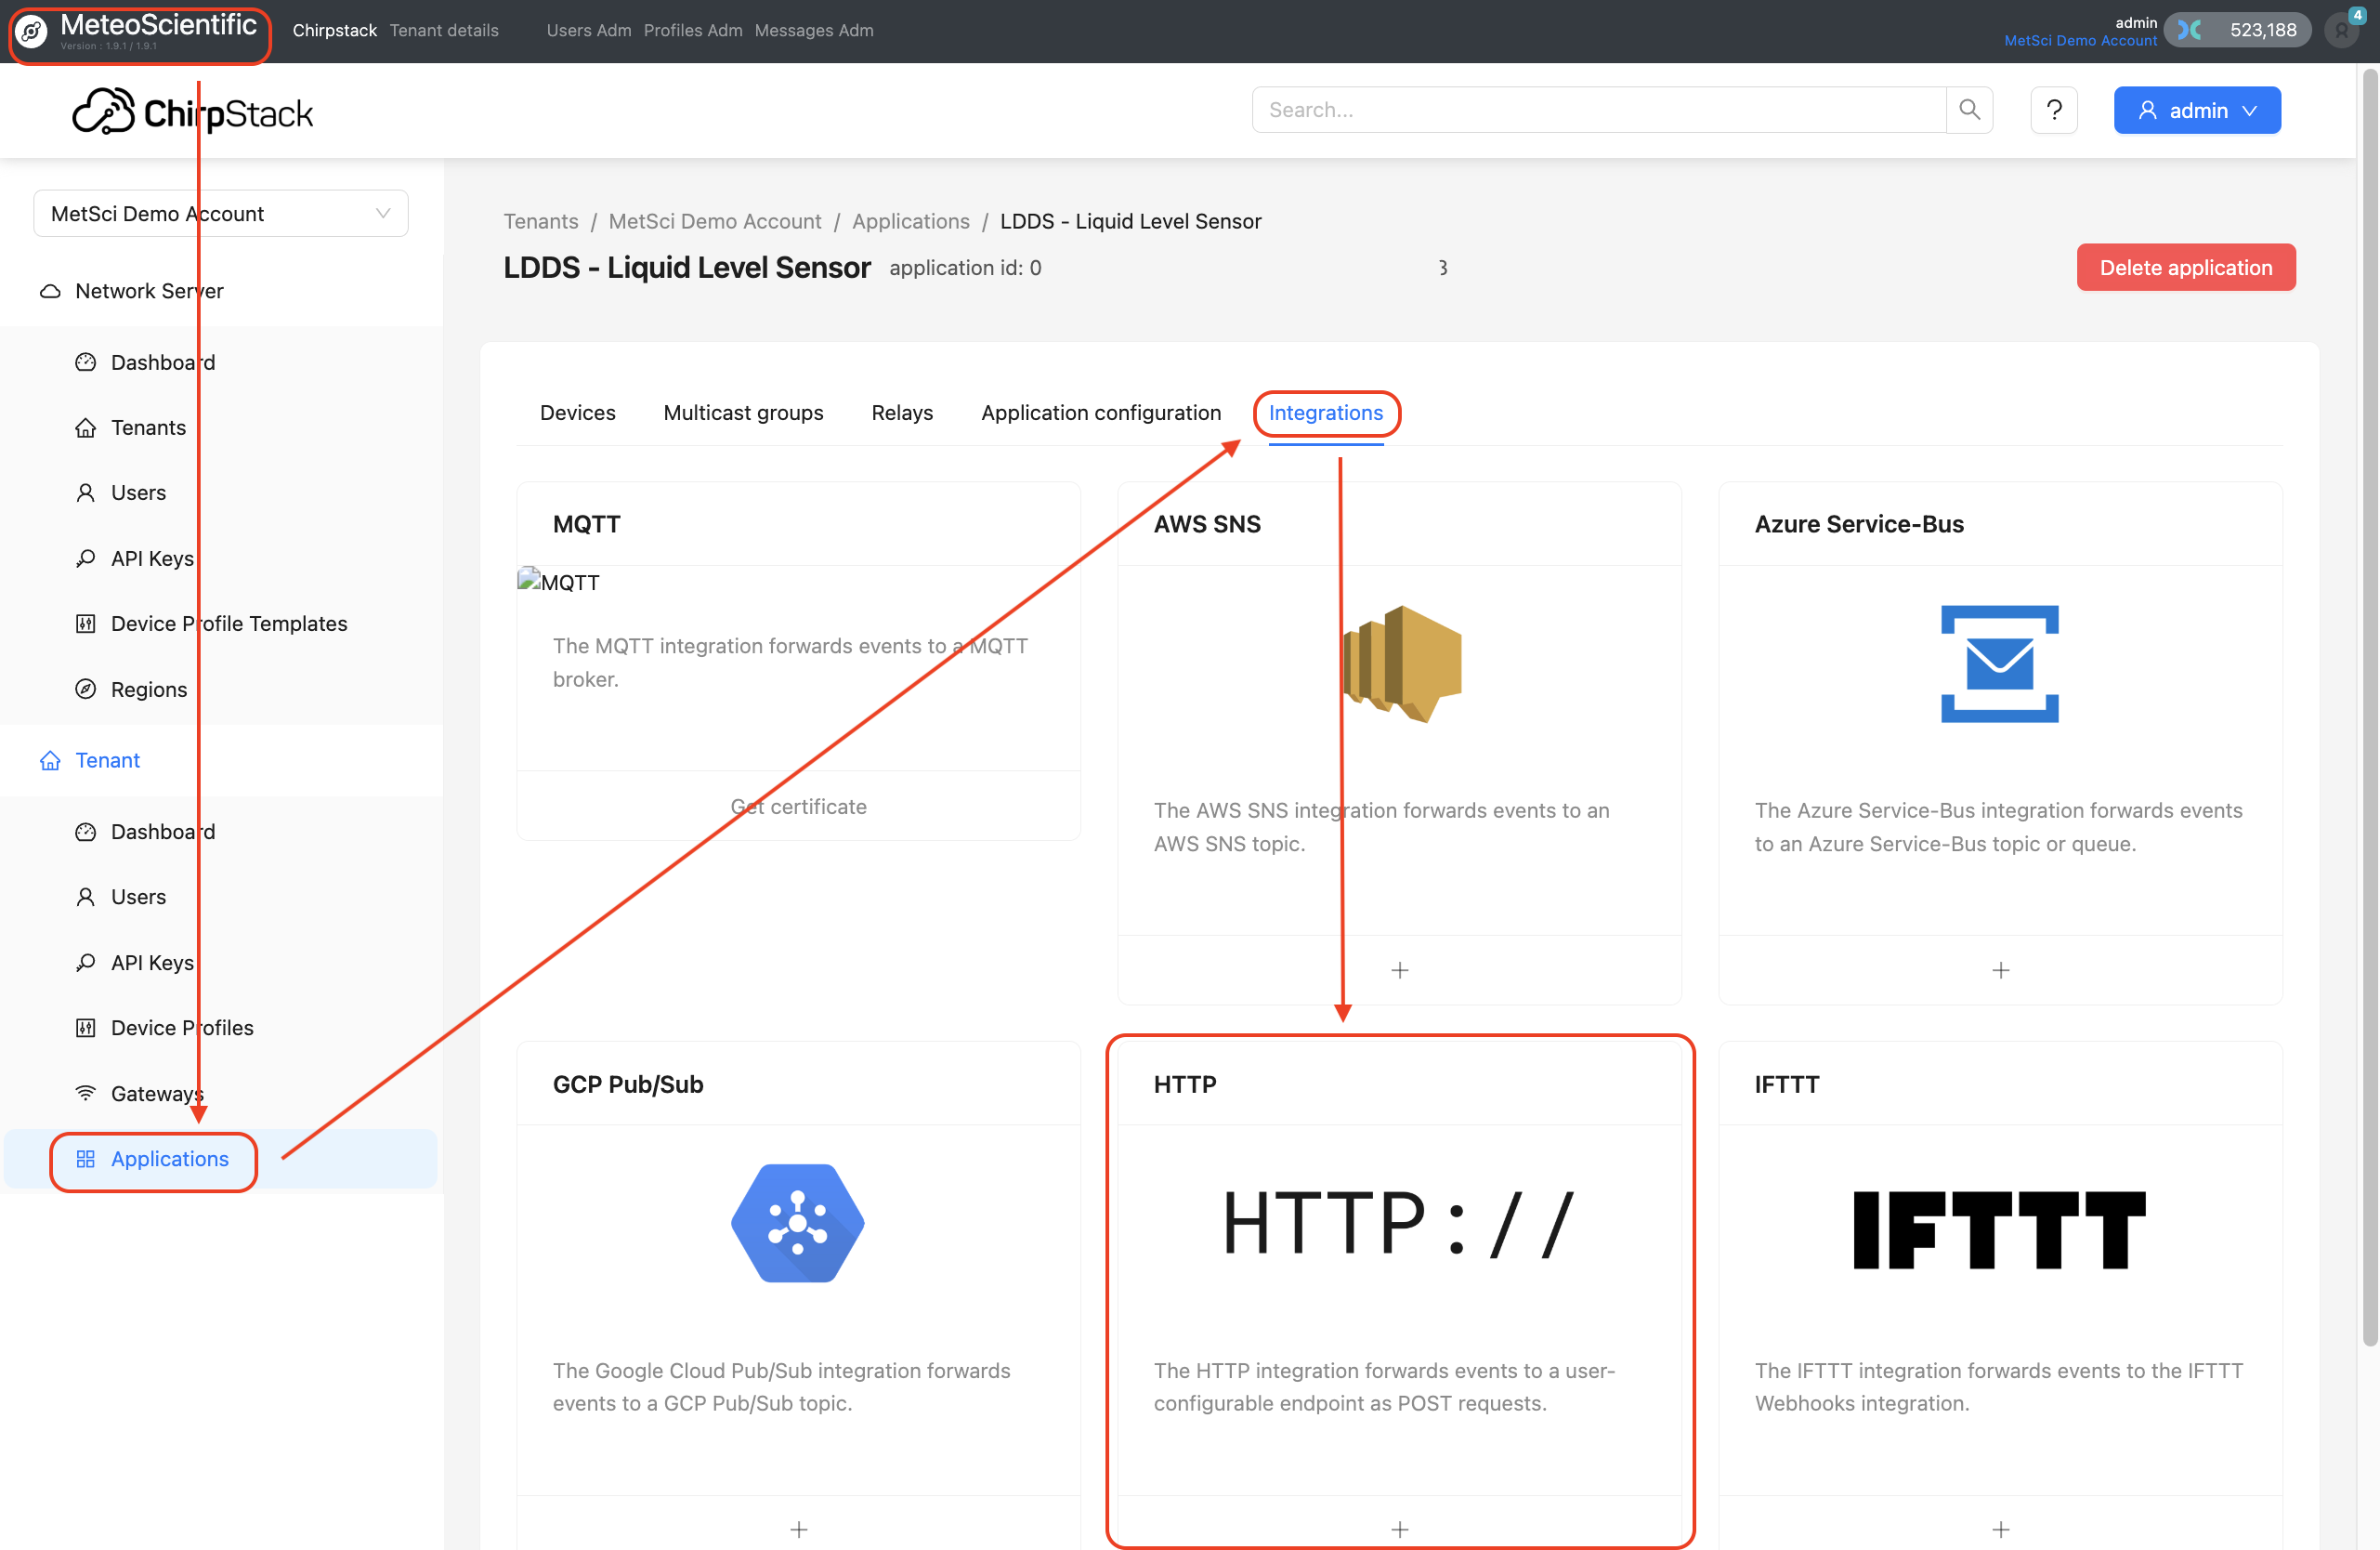
Find 'HTTP Integrations" and hit the +.
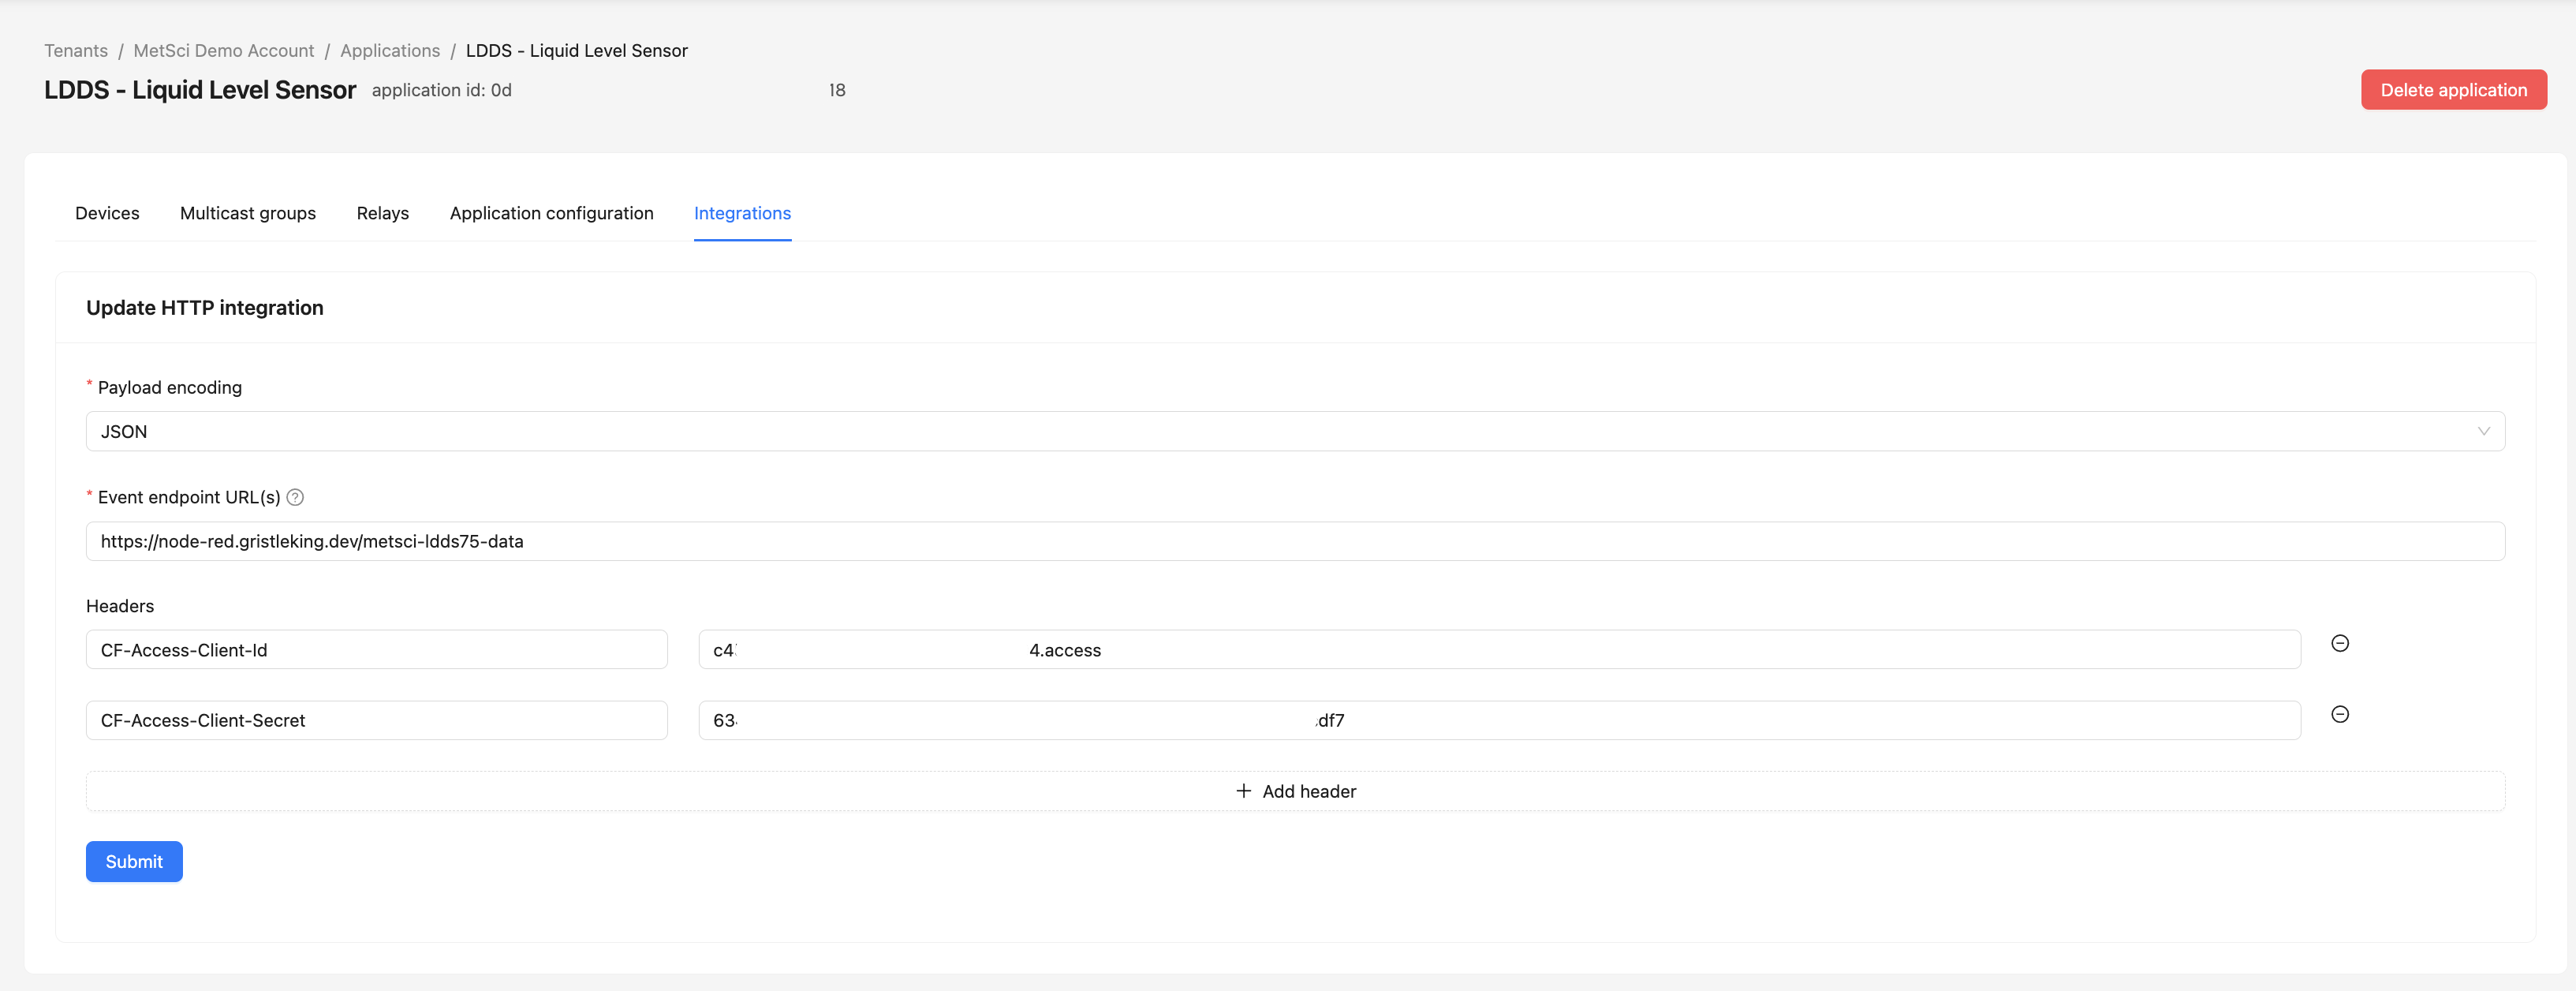
Leave the payload encoding set to JSON.
Change the event endpoint to https://node-red.<YOUR-DOMAIN>/metsci-ldds75-data/ then add two headers:
CF-Access-Client-ID <your-access-id>
CF-Access-Client-Secret <your-access-secret>
Use the Access ID and Access Secret from the Service Token you set up for the LDDS75 in Cloudflare.
Now you've set it up so the MetSci LNS can securely send data through a Zero Trust Cloudflare tunnel to Node-RED on your Raspberry Pi. Cool, right?
Nice work! The NSA can prolly still get in, but the rest of the screaming hordes should be kept at bay.
For each new sensor type you add:
- Create a new Service Token in Cloudflare named for that sensor
- Configure the HTTP integration with the new token's credentials
This maintains consistent security across all your sensor data routes.
6. Local Integration Setup
At the beginning of the tutorial we ran a script to set up all the services we'll need. Now we'll go through and configure 'em.
A. Node-RED Flows
Node-RED is a flow-based programming tool that allows you to create data flows between nodes. In this case, our nodes represent the data flow between MetSci, the InfluxDB database on our Pi, and Grafana.
Visit Node-RED at http://<YOUR-PI-IP>:1880 in a browser.
If you haven't already logged in (back when we set up the services), you'll see a login screen. Use the user & pass that was setup during the service setup. You DID save those credentials, right?
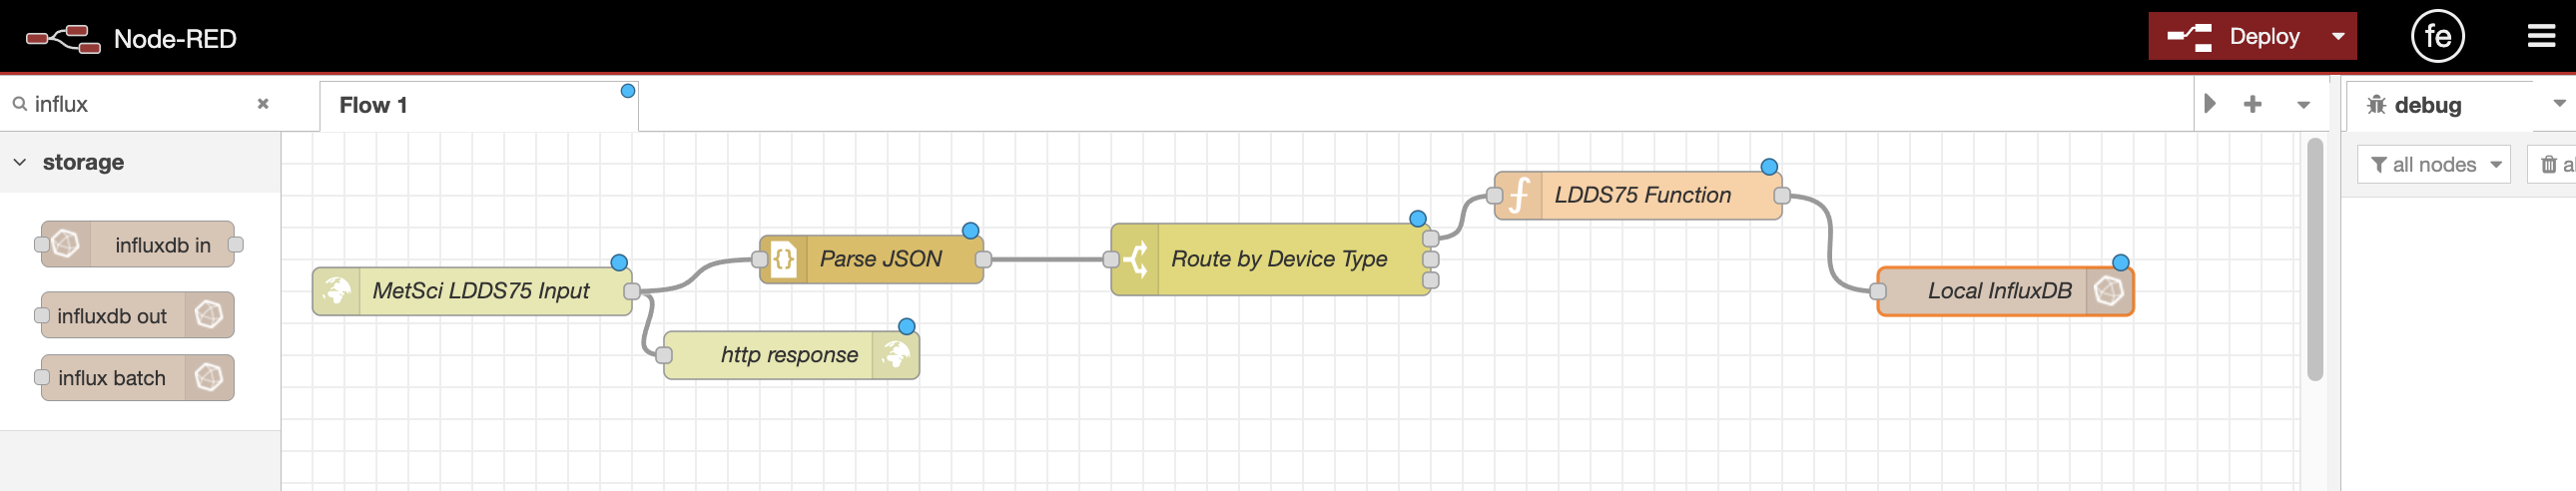
Let me show you the whole "flow" first, it'll help you understand how it works.
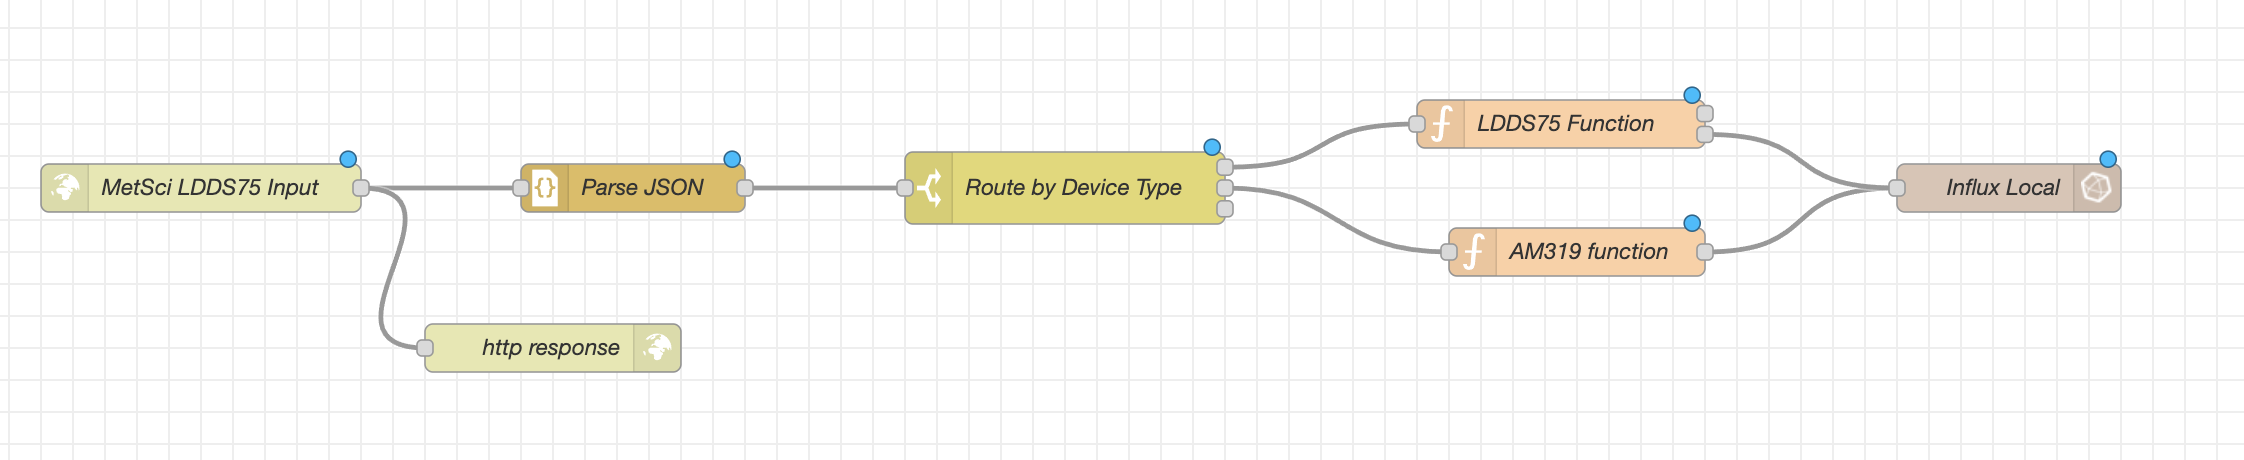
1. HTTP In
We'll start with an HTTP In node, labeled on the image above as MetSci LDDS75 Input. Think of it as the greeter at Wal-Mart. "Hey, how you doing, are you decent and sober? Come on in!"
To add a node, you find it in the left menu bar, or just start typing in the name of the node at the top. Once you see it, drag it onto the workspace.
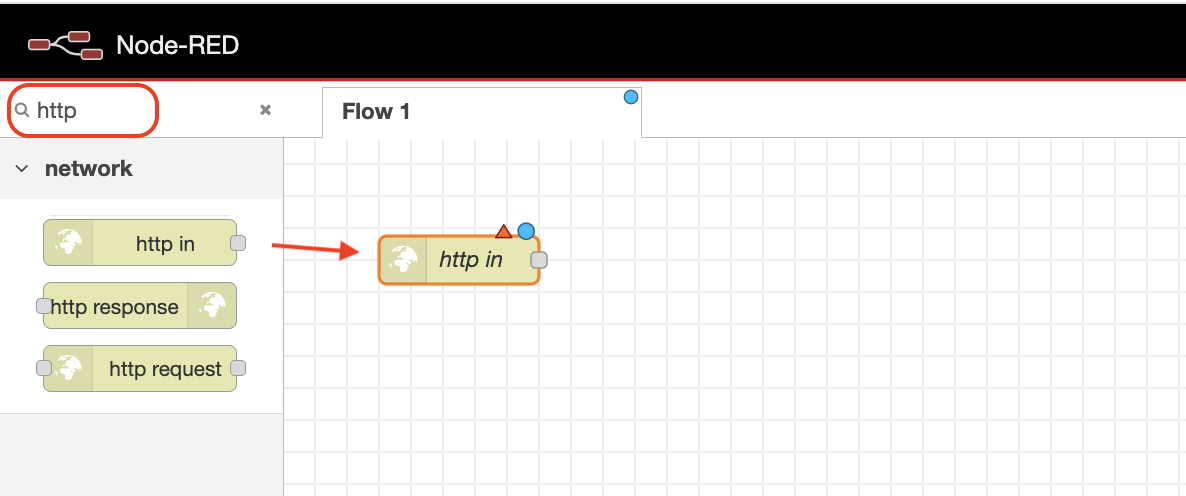
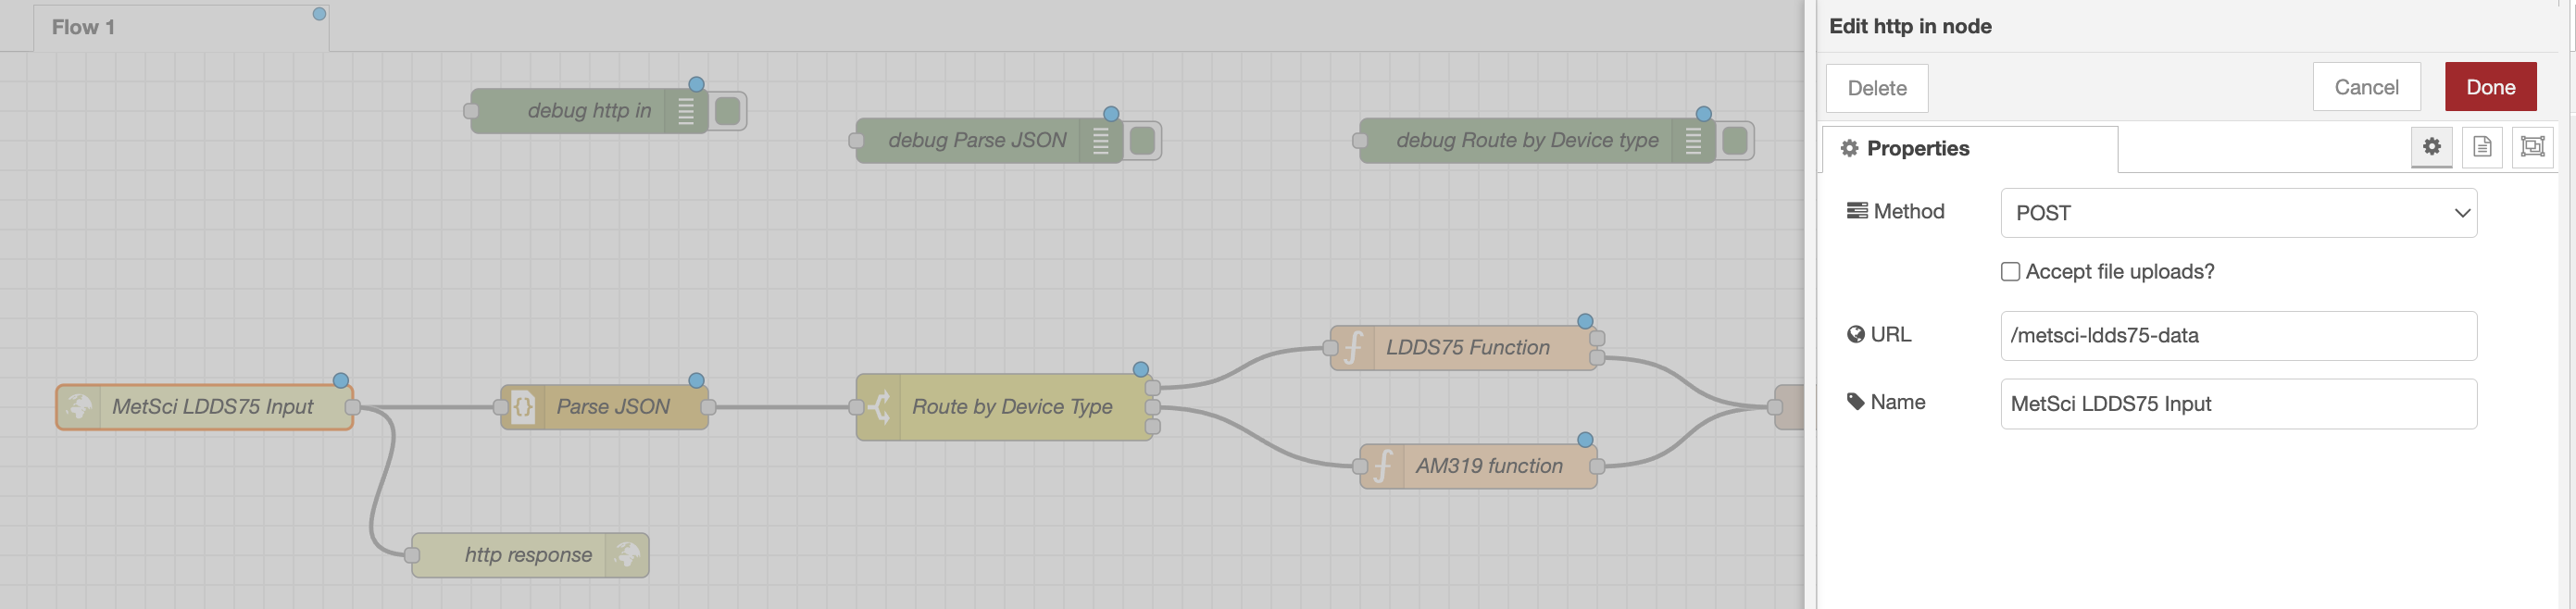
Once you've dragged a node in, double click it to configure it. For the HTTP In node:
- Method:
POST - URL:
/metsci-ldds75-data - Name:
MetSci LDDS75 Input
2. HTTPS Response
Next we'll add in a https response node. This node will let the tunnel know everything is working and follow the best practices of always responding to http requests. It's like when someone says "Hi" to you in the street; just say "Hi" back.
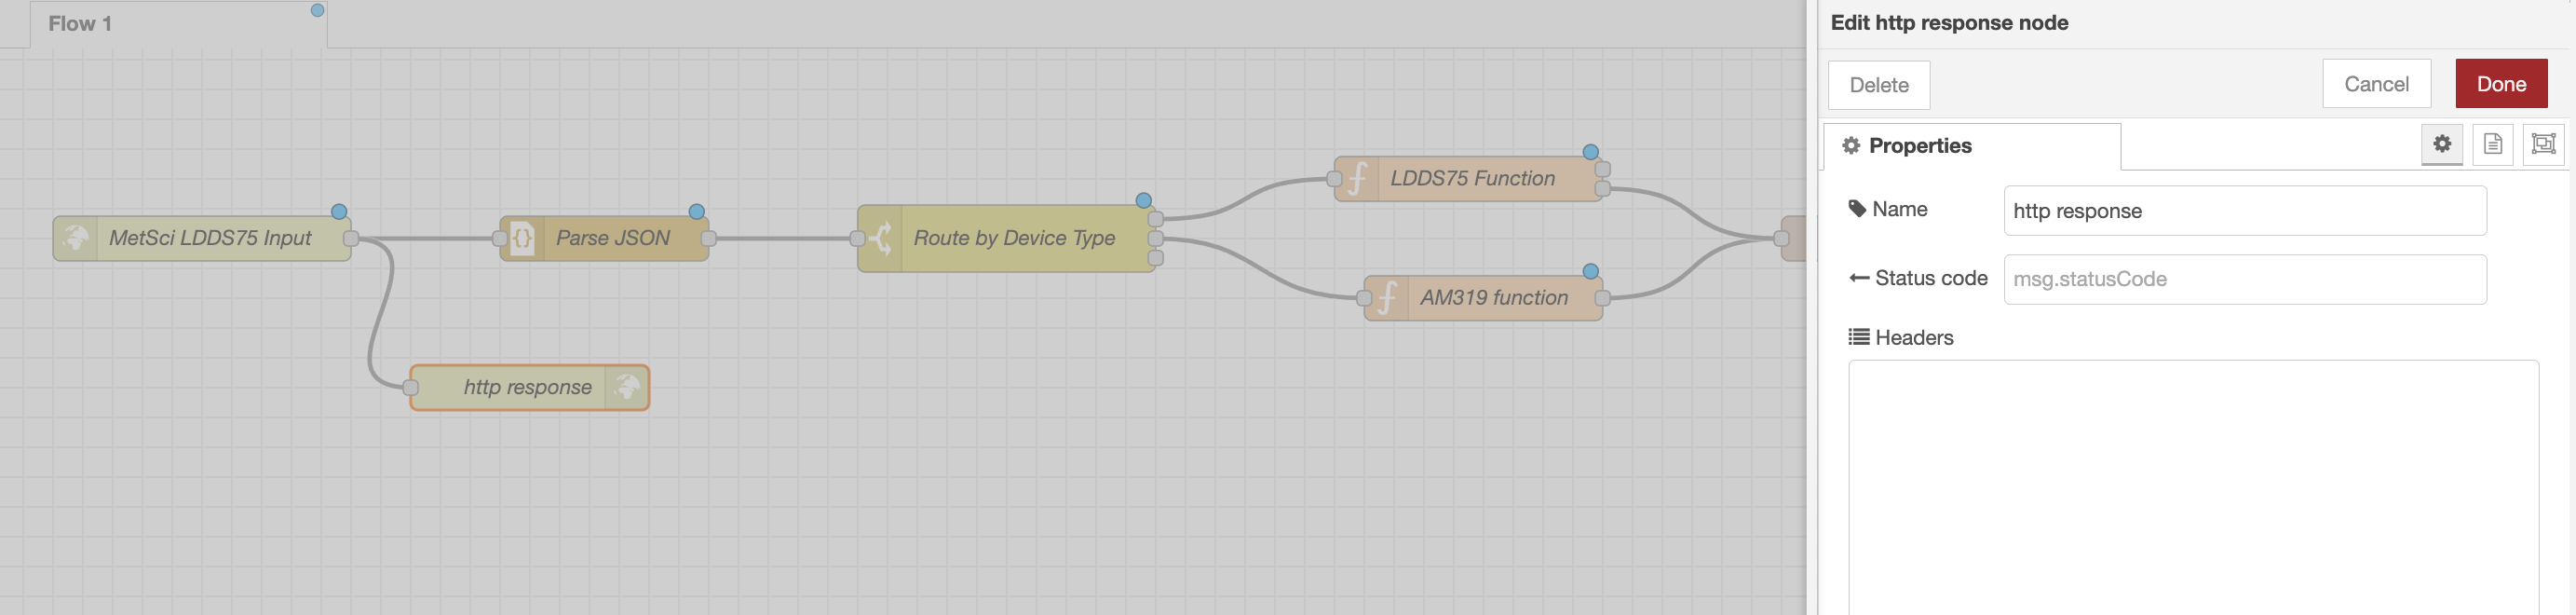
Just make sure you name it; leave everything else blank.
With two nodes in the workspace, you can start connecting 'em. Drag a "wire" from the grey dot on the right side of the HTTP In node to the grey dot on the left side of the HTTPS Response node.
3. JSON
Now we'll add and configure a JSON node. JSON nodes standardize the incoming data, parse errors, and make sure the next node in the flow gets the right data.
- Search for
jsonand add it to your workspace - Double-click to configure:
- Action:
Always Conver to JavaScript Object - Property:
msg.payload - Name:
Parse JSON
- Action:
- Click Done to save
This ensures our data is in the right format for processing, whether it comes from our test Inject node or the HTTP In node.
Now drag a wire from the HTTP IN node to the Parse JSON node. At this point, you'll have a wire from the HTTP In node to the Parse JSON node, and a wire from the Parse JSON node to the HTTPS Response node.
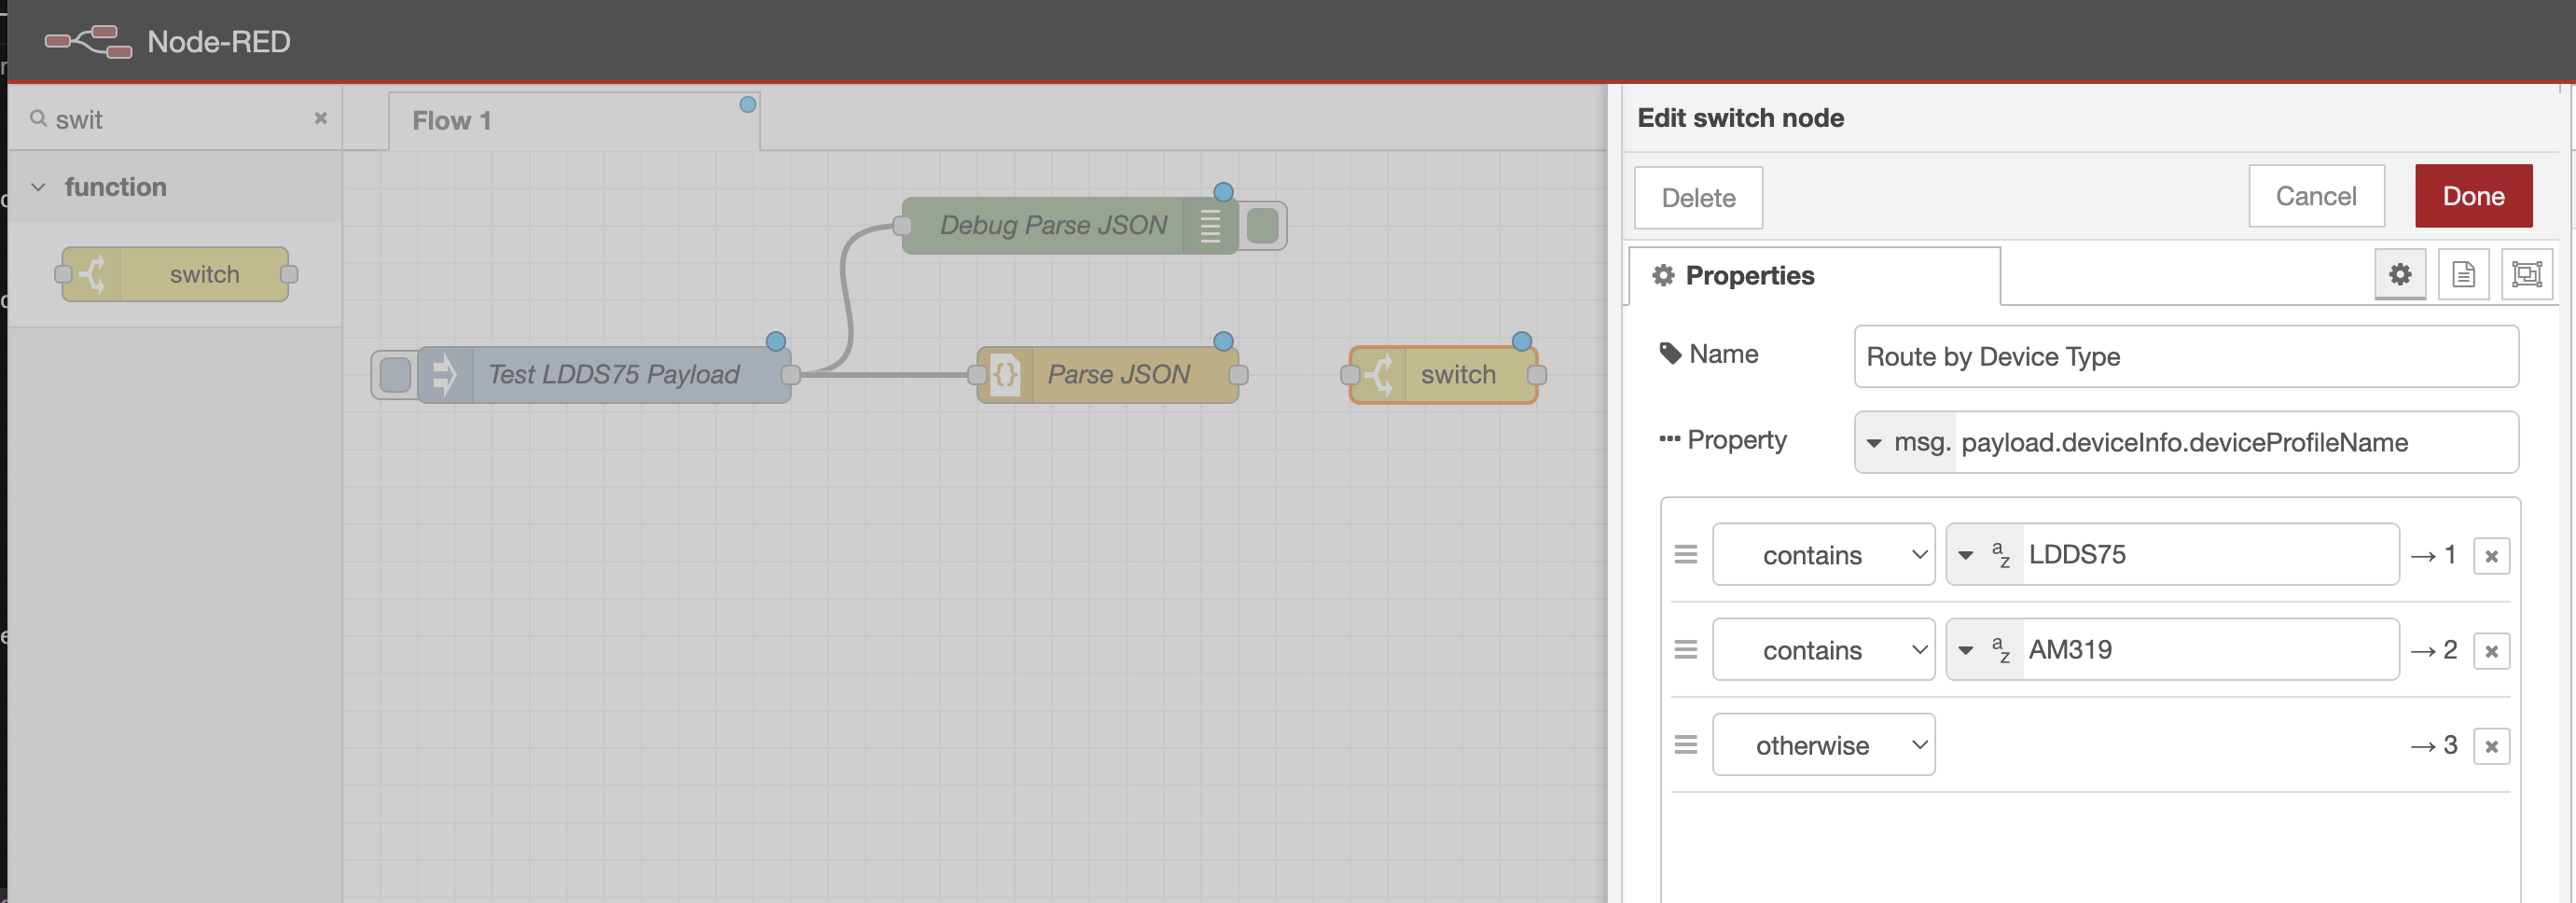
4. Switch
Next we'll add a Switch node to route the data to the correct sensor function.
- Search for
switchand add it to your workspace - Double-click to configure:
- Name:
Route by Device Type - Property:
msg.payload.deviceInfo.deviceProfileName - Rules:
- First rule:
- Operator:
contains - Value:
LDDS75
- Operator:
- Click
+to add second rule:- Operator:
contains - Value:
AM319(just a demo for this tutorial)
- Operator:
- First rule:
- Check "otherwise" to catch unknown devices
- Name:
- Click Done to save
This node examines the device profile name in the incoming message and routes it to the appropriate function node.
If the incoming message contains "LDDS75", it goes to output 1, if it contains "AM319" (which we haven't set up yet), it goes to output 2, and any unknown devices go to the "otherwise" output where you can handle them (e.g., with a debug node to see what arrived).
Wire the Parse JSON node to the Switch node.
5. Function
Add a Function node for the LDDS75. Function nodes are what allow us to correctly setup the data for insertion into InfluxDB. A JSON node cleans up the data, the Switch node routes it to the correct sensor function, and a Function node formats it for InfluxDB.
Search for a function node and add it to your workspace. The LDDS75 specs say it can measure from 280mm to 7500mm. You'll want to modify the following function to match your tank size. I'm using a 1200mm diameter, 1850mm height tank.
- Double-click to configure:
- Name it
LDDS75 Function - Paste the following code into the
Messagetab of the Function node:
- Name it
try {
    // Log receipt of message
    node.warn("LDDS75 function processing message");

    const originalPayload = msg.payload;
    const gateway = originalPayload.rxInfo?.[0] || {};

    // Get the distance value first and validate it
    const distance = parseInt(originalPayload.object?.distance || 0);

    // Validate distance reading (LDDS75 range: 280-7500mm for flat objects)
    if (!distance || distance < 280 || distance > 7500) {
        node.warn("Invalid distance reading: " + distance + "mm - outside LDDS75 range (280-7500mm)");
        return null;
    }

    // Optional: Tank-specific validation (comment out or adjust as needed)
    const MAX_TANK_HEIGHT = 1850; // adjust this to your tank height
    if (distance > MAX_TANK_HEIGHT) {
        node.warn("Reading exceeds tank height: " + distance + "mm > " + MAX_TANK_HEIGHT + "mm");
        return null;
    }

    // Create payload array with fields and tags objects
    msg.payload = [
        {
            // Sensor data
            distance: distance,
            battery: parseFloat(originalPayload.object?.battery_voltage || 0),
            temperature: parseFloat(originalPayload.object?.temperature || 0),

            // RF metrics
            rssi: parseInt(gateway.rssi || 0),
            snr: parseFloat(gateway.snr || 0),
            frequency: parseInt(originalPayload.txInfo?.frequency || 0),
            spreading_factor: parseInt(originalPayload.dr || 0),
            bandwidth: parseInt(originalPayload.txInfo?.modulation?.lora?.bandwidth || 0),

            // Frame counter and port
            frame_counter: parseInt(originalPayload.fCnt || 0),
            port: parseInt(originalPayload.fPort || 0)
        },
        {
            // Device info
            device: String(originalPayload.deviceInfo?.deviceName || ""),
            device_eui: String(originalPayload.deviceInfo?.devEui || ""),
            device_addr: String(originalPayload.devAddr || ""),
            device_class: String(originalPayload.deviceInfo?.deviceClassEnabled || ""),
            device_profile: String(originalPayload.deviceInfo?.deviceProfileName || ""),

            // Application info
            application: String(originalPayload.deviceInfo?.applicationName || ""),
            application_id: String(originalPayload.deviceInfo?.applicationId || ""),

            // Gateway info
            gateway: String(gateway.metadata?.gateway_name || ""),
            gateway_id: String(gateway.gatewayId || ""),

            // Network info
            region: String(gateway.metadata?.region_common_name || ""),
            network: String(gateway.metadata?.network || ""),
            tenant: String(originalPayload.deviceInfo?.tenantName || "")
        }
    ];

    // Set measurement name
    msg.measurement = "ldds75_metsci";

    // Add timestamp (convert to nanoseconds for InfluxDB)
    const timestamp = new Date(originalPayload.time).getTime() * 1000000;
    if (isNaN(timestamp)) {
        node.warn("Invalid timestamp");
        return null;
    }
    msg.payload[0].timestamp = timestamp;

    // Log the attempt
    node.warn("Writing to InfluxDB - Device: " + msg.payload[1].device + ", Distance: " + distance + " mm");

    return msg;
} catch (err) {
    node.error("LDDS75 Processing Error: " + err.message);
    node.error("Failed payload: " + JSON.stringify(msg.payload, null, 2));
    node.status({ fill: "red", shape: "dot", text: "Processing Error" });
    return null;
}
Make sure you drag the wire from the correct connector on the Switch node (the top one, but you can hover over the node to see which connector is which) to the next node in the flow. In this case, that'll be our LDDS75 Function node.
6. InfluxDB out
Add an InfluxDB out node to the Function node to store the data in InfluxDB.
- Double-click the node to configure it.
- Name the node
Local InfluxDB
Click the + icon next to the "Server" field to create a new InfluxDB server configuration
- Fill in the InfluxDB server properties:
Name: [your org name, copy this from your credentials file]
Version: 2.0
URL: http://localhost:8086
Token: [paste in your InfluxDB token from your credentials file]
Leave other settings as is
Addto save the server configuration
Now, in the InfluxDB Out node configuration:
Name: Local InfluxDB
Server: [should be the server you just set up]
Organization: [your org name, copy this from your credentials file]
Bucket: sensors [also in the credentials file]
Measurement: [leave blank]
Time precision: `Nanoseconds`
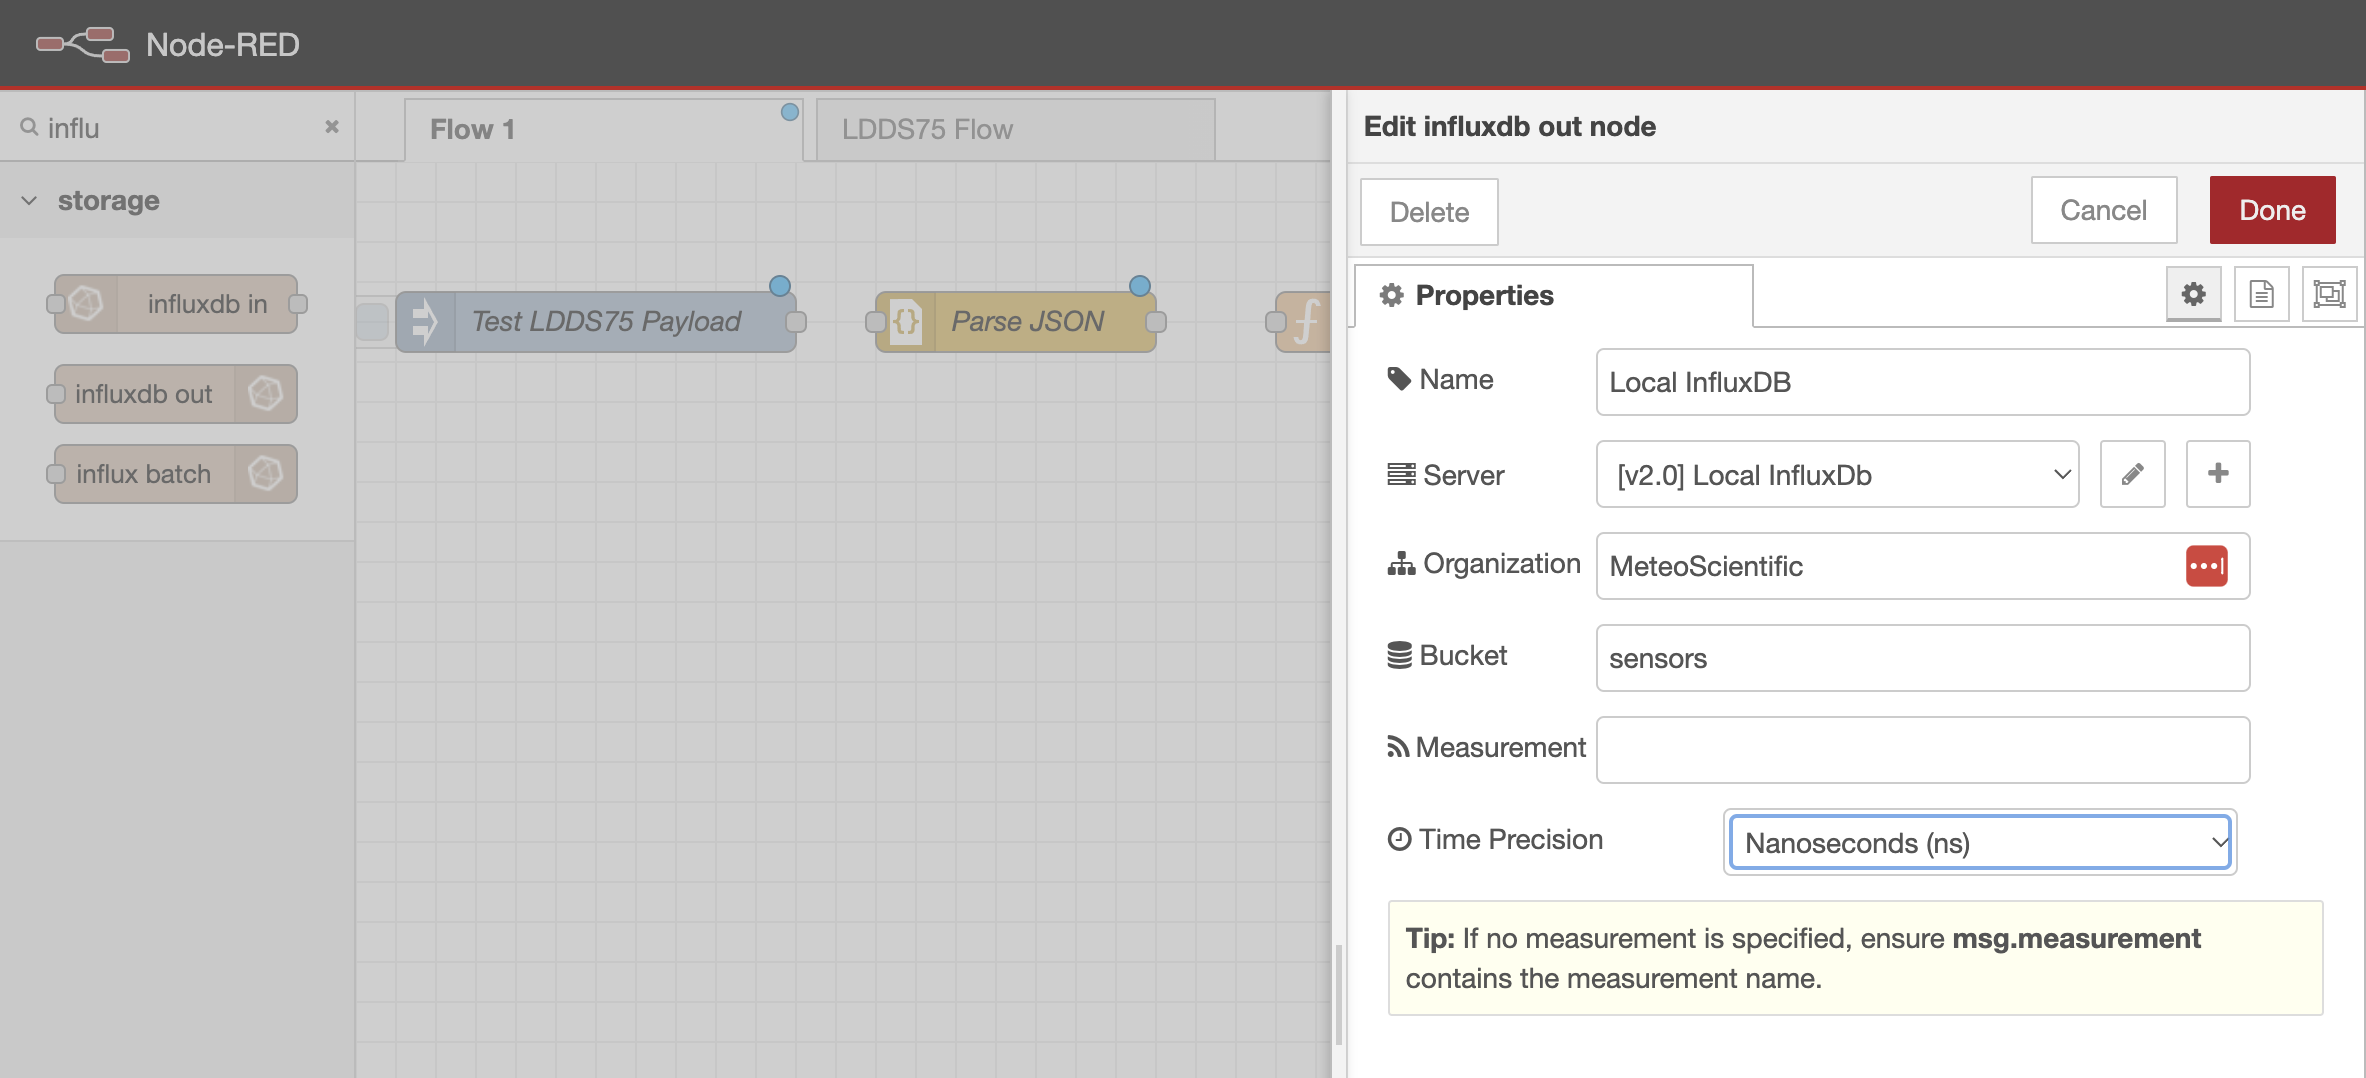
Click Done to save the node, then click Deploy in the top-right.
7. Debug
Now, the pro move here is to add in Debug nodes. It's not required, but it's what I've done. Add a Debug node to every one our regular nodes. That way we'll see what's going through the whole flow the next time we have a packet come through.
For all of those:
- Set Output to `msg.payload`
- Name it something descriptive
8. Deploy and test
With your flow set up, click Deploy in the top-right.

You should see a green bar and the word "Deployed" at the top of the screen.
Now go back to your LDDS75 and power it back on. Since you set it to fire on a one minute interval, you'll know quickly if everything is working or not as you'll see the data start flowing through in the debug panel on the right side.
Remember, it might take a minute or two for the first join to complete and the data to start flowing.
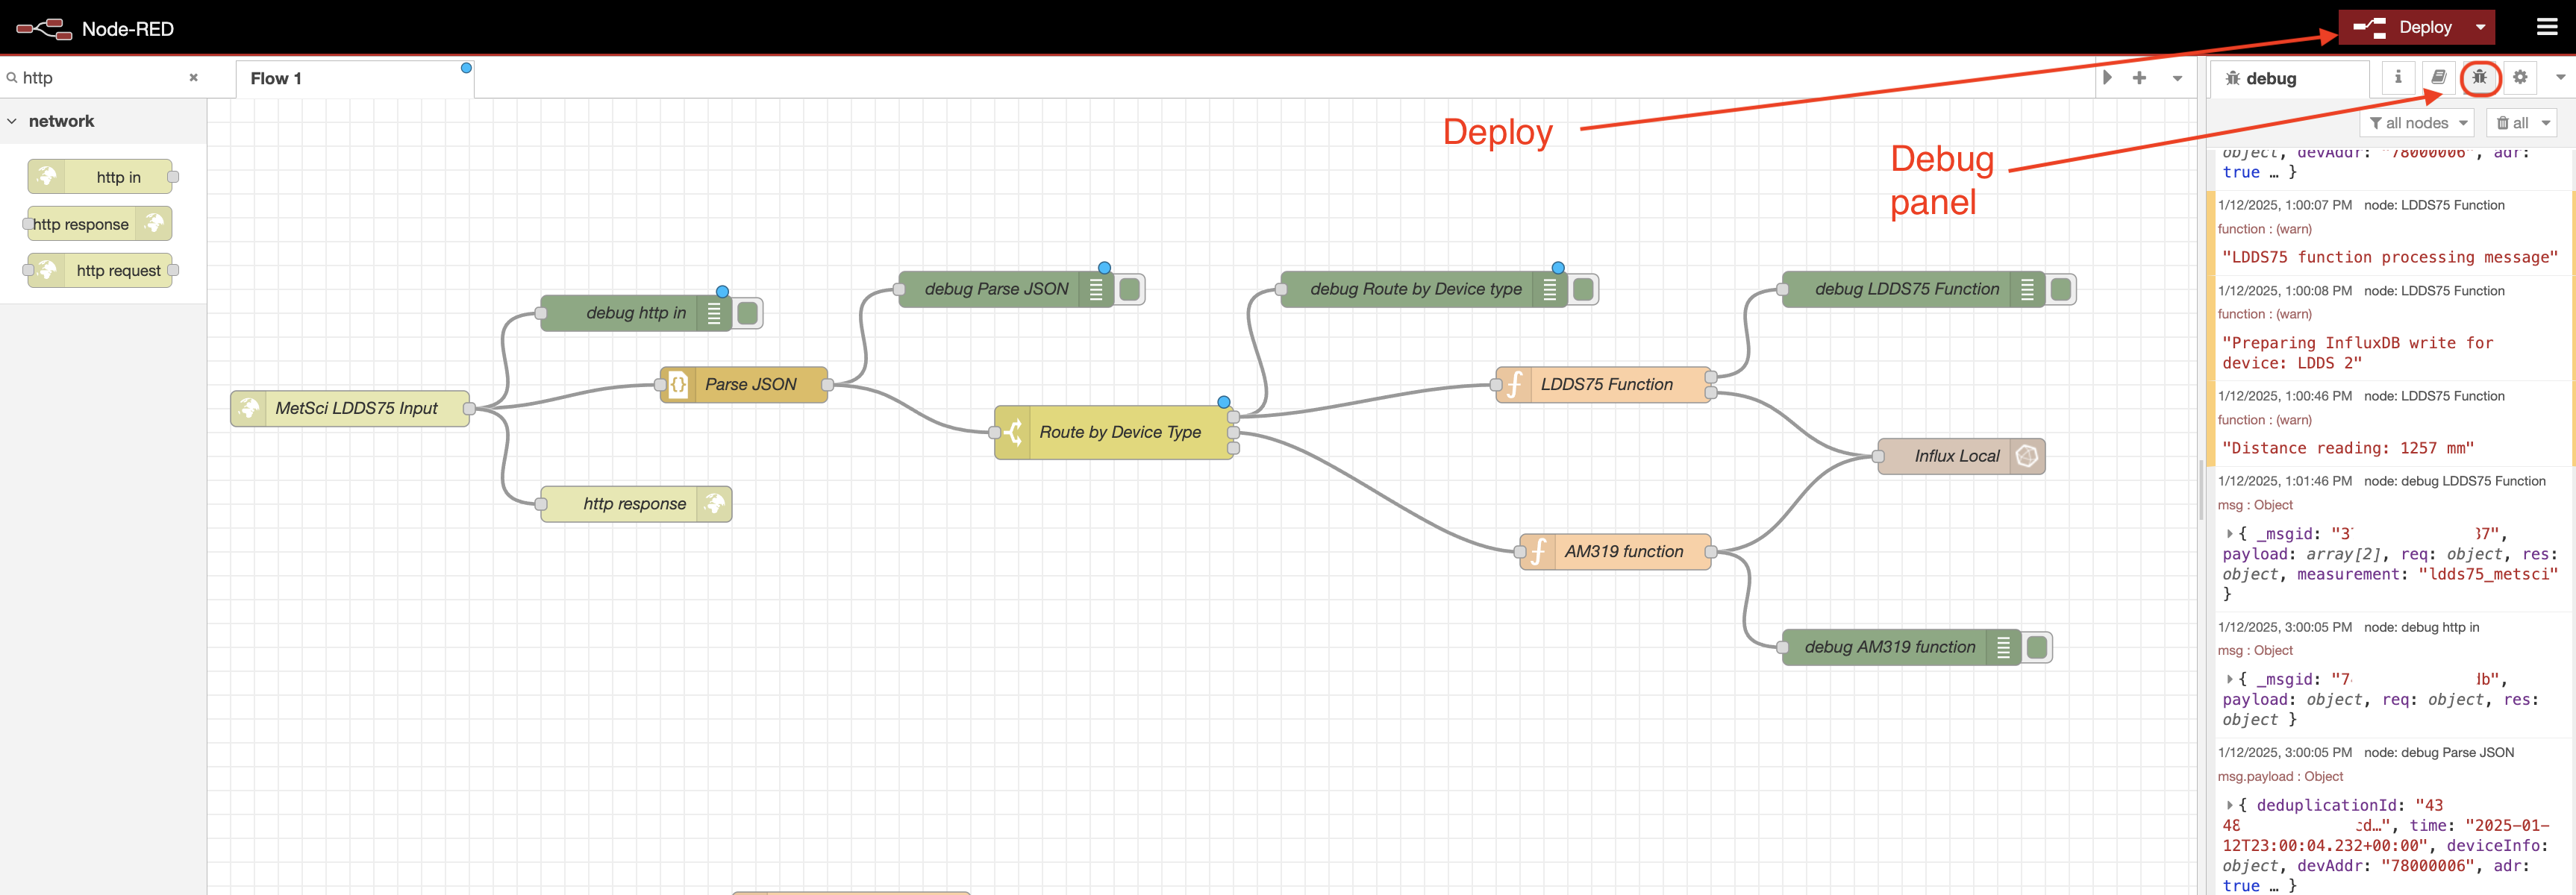
This modular structure makes it easy to add more sensors later. You can see I've added an AM319 sensor to the flow above in the image. Each sensor follows the same basic pattern:
- HTTP In (receives data)
- JSON parser
- Switch (routes data to the correct sensor function)
- Sensor Function (formats data for your needs)
- InfluxDB out (stores data)
B. InfluxDB Check
Let's check our InfluxDB to see if the data made it there. Go to http://your-pi:8086 and sign in with the credentials from your installation.
Go to Data Explorer (the graphy icon on the left menu) and run a query for ldds75 by pasting in the query below and hitting "Submit". Hit the View Raw Data button (not circled in the image). You should see your data there.
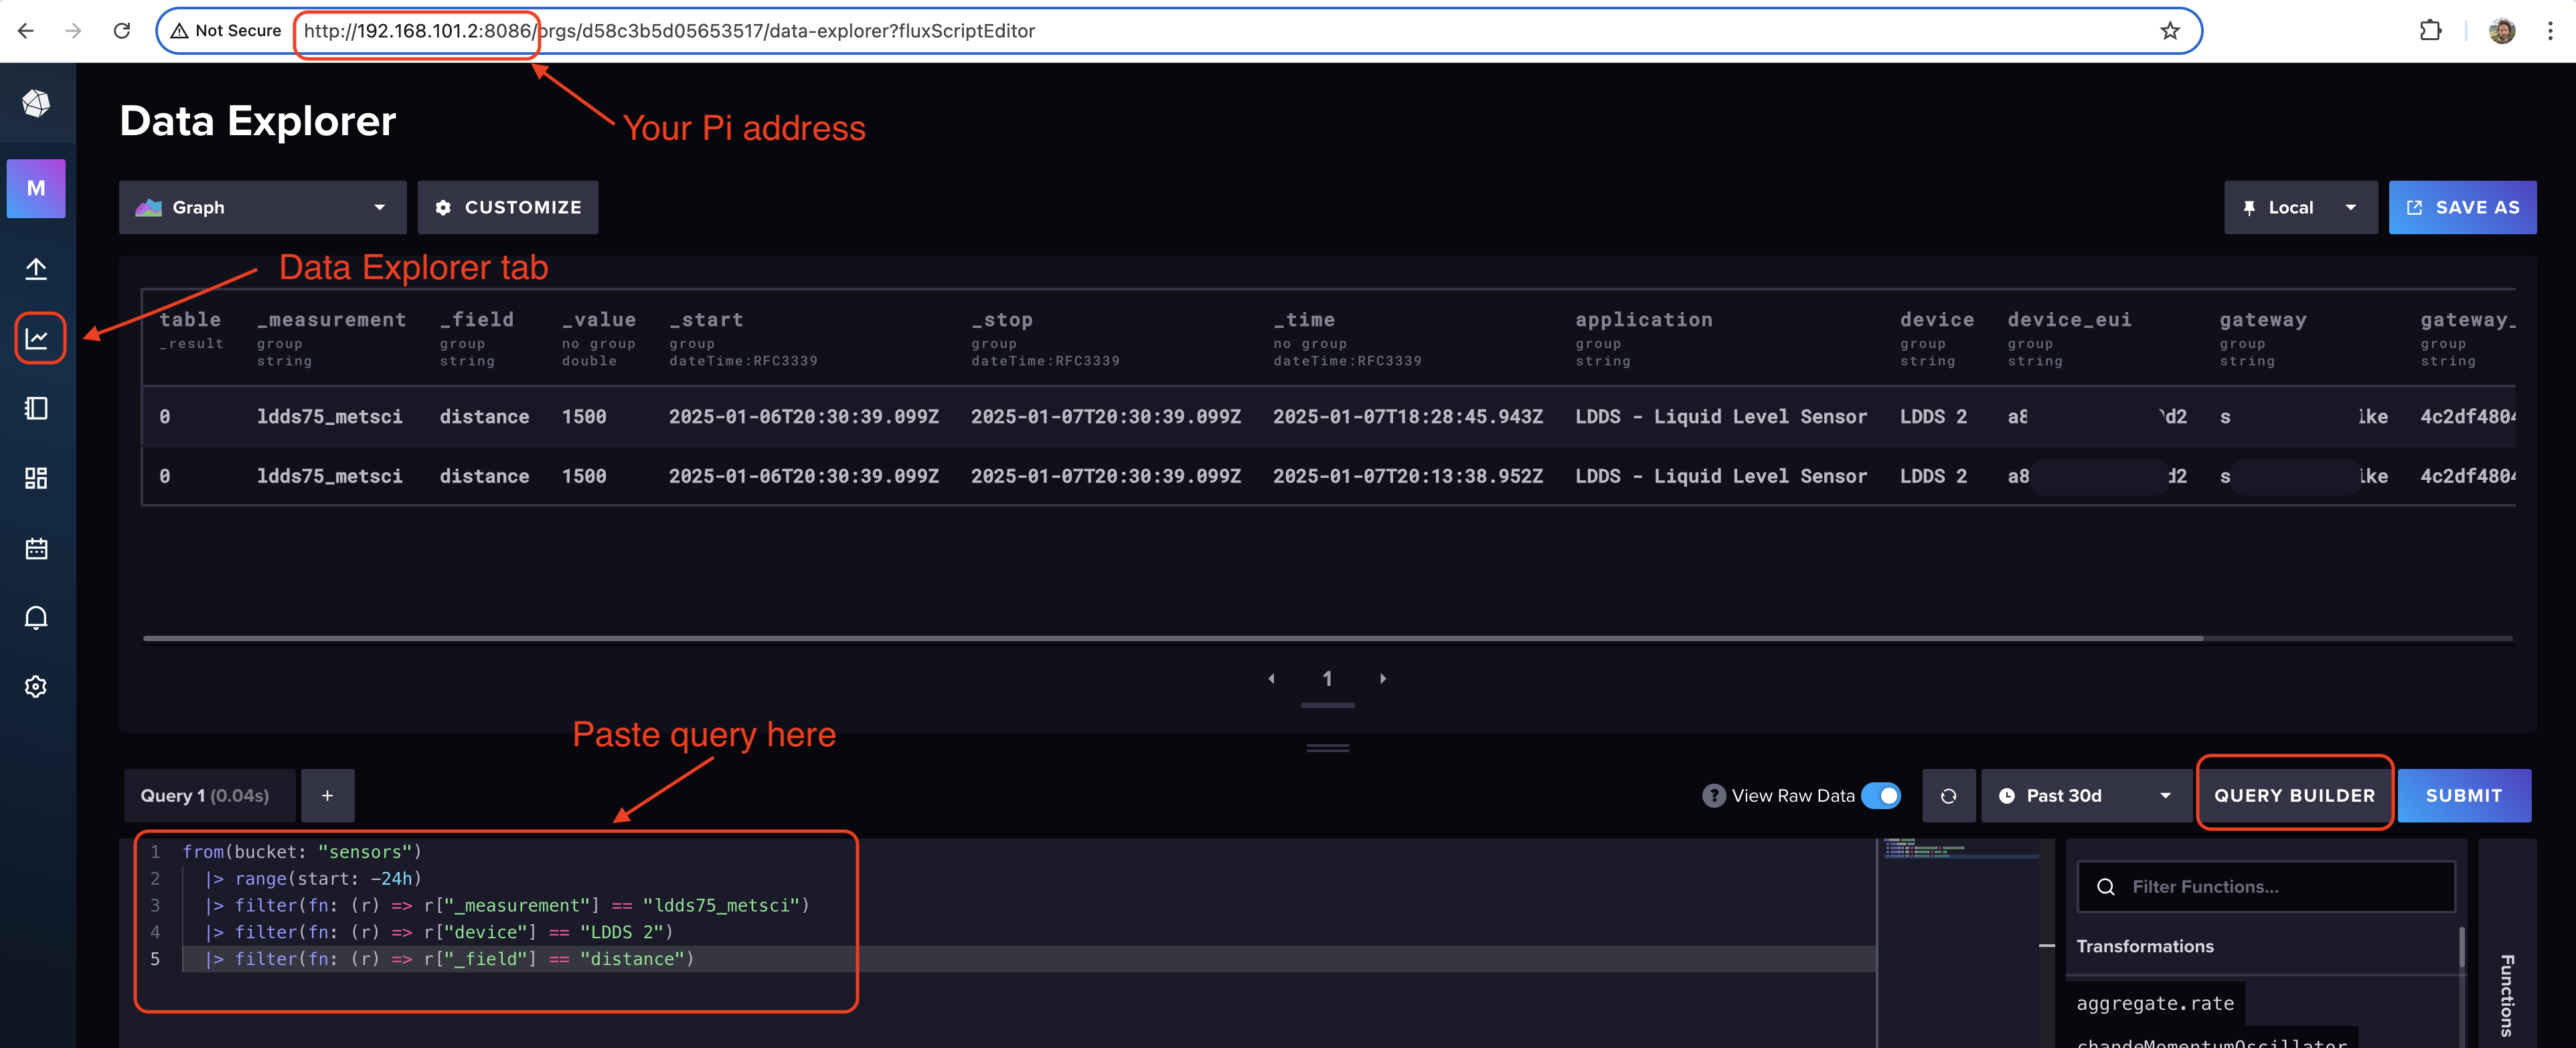
Here are three script queries you can use. These use my DEVICE NAME, in this case LDDS 3, so make sure you change that to your own.
The first query gives you the basic distance to liquid surface:
from(bucket: "sensors")
  |> range(start: -24h)
  |> filter(fn: (r) => r["_measurement"] == "ldds75_metsci")
  |> filter(fn: (r) => r["device"] == "LDDS 3")
  |> filter(fn: (r) => r["_field"] == "distance")
  |> keep(columns: ["_time", "_value", "device"])
  |> yield(name: "mm_to_surface")
I built 2 more queries to see my data using my barrel size (1200mm diameter, 1850mm height).
A quick note here on metric. I'm a slowly-converting-to-metric American, so while I'll use mm for distance, I'll convert to gallons for volume. Sorry, old habits die hard.
First, I'll check the current water volume in gallons, again using my DEVICE NAME, in this case LDDS 3:
from(bucket: "sensors")
  |> range(start: -24h)
  |> filter(fn: (r) => r["_measurement"] == "ldds75_metsci")
  |> filter(fn: (r) => r["device"] == "LDDS 3")
  |> filter(fn: (r) => r["_field"] == "distance")
  |> map(fn: (r) => ({
       r with _value: float(v: 3.14159) * ((600.0/1000.0) ^ 2.0) * (1850.0 - float(v: r._value))/1000.0 * 264.172
     }))
  |> keep(columns: ["_time", "_value", "device"])
  |> yield(name: "gallons")
Here's another query you could use that would also pull the gateway name that's receiving your data,as well as the distance and RSSI fields. You might use this to keep track of what kind of coverage you're getting from a given gateway.
from(bucket: "sensors")
  |> range(start: -24h)
  |> filter(fn: (r) => r["_measurement"] == "ldds75_metsci")
  |> filter(fn: (r) => r["gateway"] == "dancing-daffodil-cheetah")
  |> filter(fn: (r) => r["region"] == "US915")
  |> filter(fn: (r) => r["_field"] == "distance" or r["_field"] == "rssi")
  |> keep(columns: ["_time", "_value", "_field", "device", "gateway"])
These are all fairly simple queries, but you may still have problems. We're nerds, and nerd stuff usually don't work right the first time. That's OK. If you have problems, start by checking to make sure your queries in InfluxDB match your Device Names, Gateway, and Region. If you just copy/paste exactly what I put, you're not going to see anything because it'll be looking for my DEVICE NAME, in this case LDDS 3. By far the fastest way to debug on your own is to feed in messages from Node-RED debug and InfluxDB, and drop screenshots into ChatGPT/Cursor/Grok etc.
C. Grafana Dashboards
Now let's head over to Grafana and set up a dashboard, woohoo!
Go to the local Grafana at http://your-pi:3000 and sign in with the credentials from your installation. You'll see something like this after you sign in:
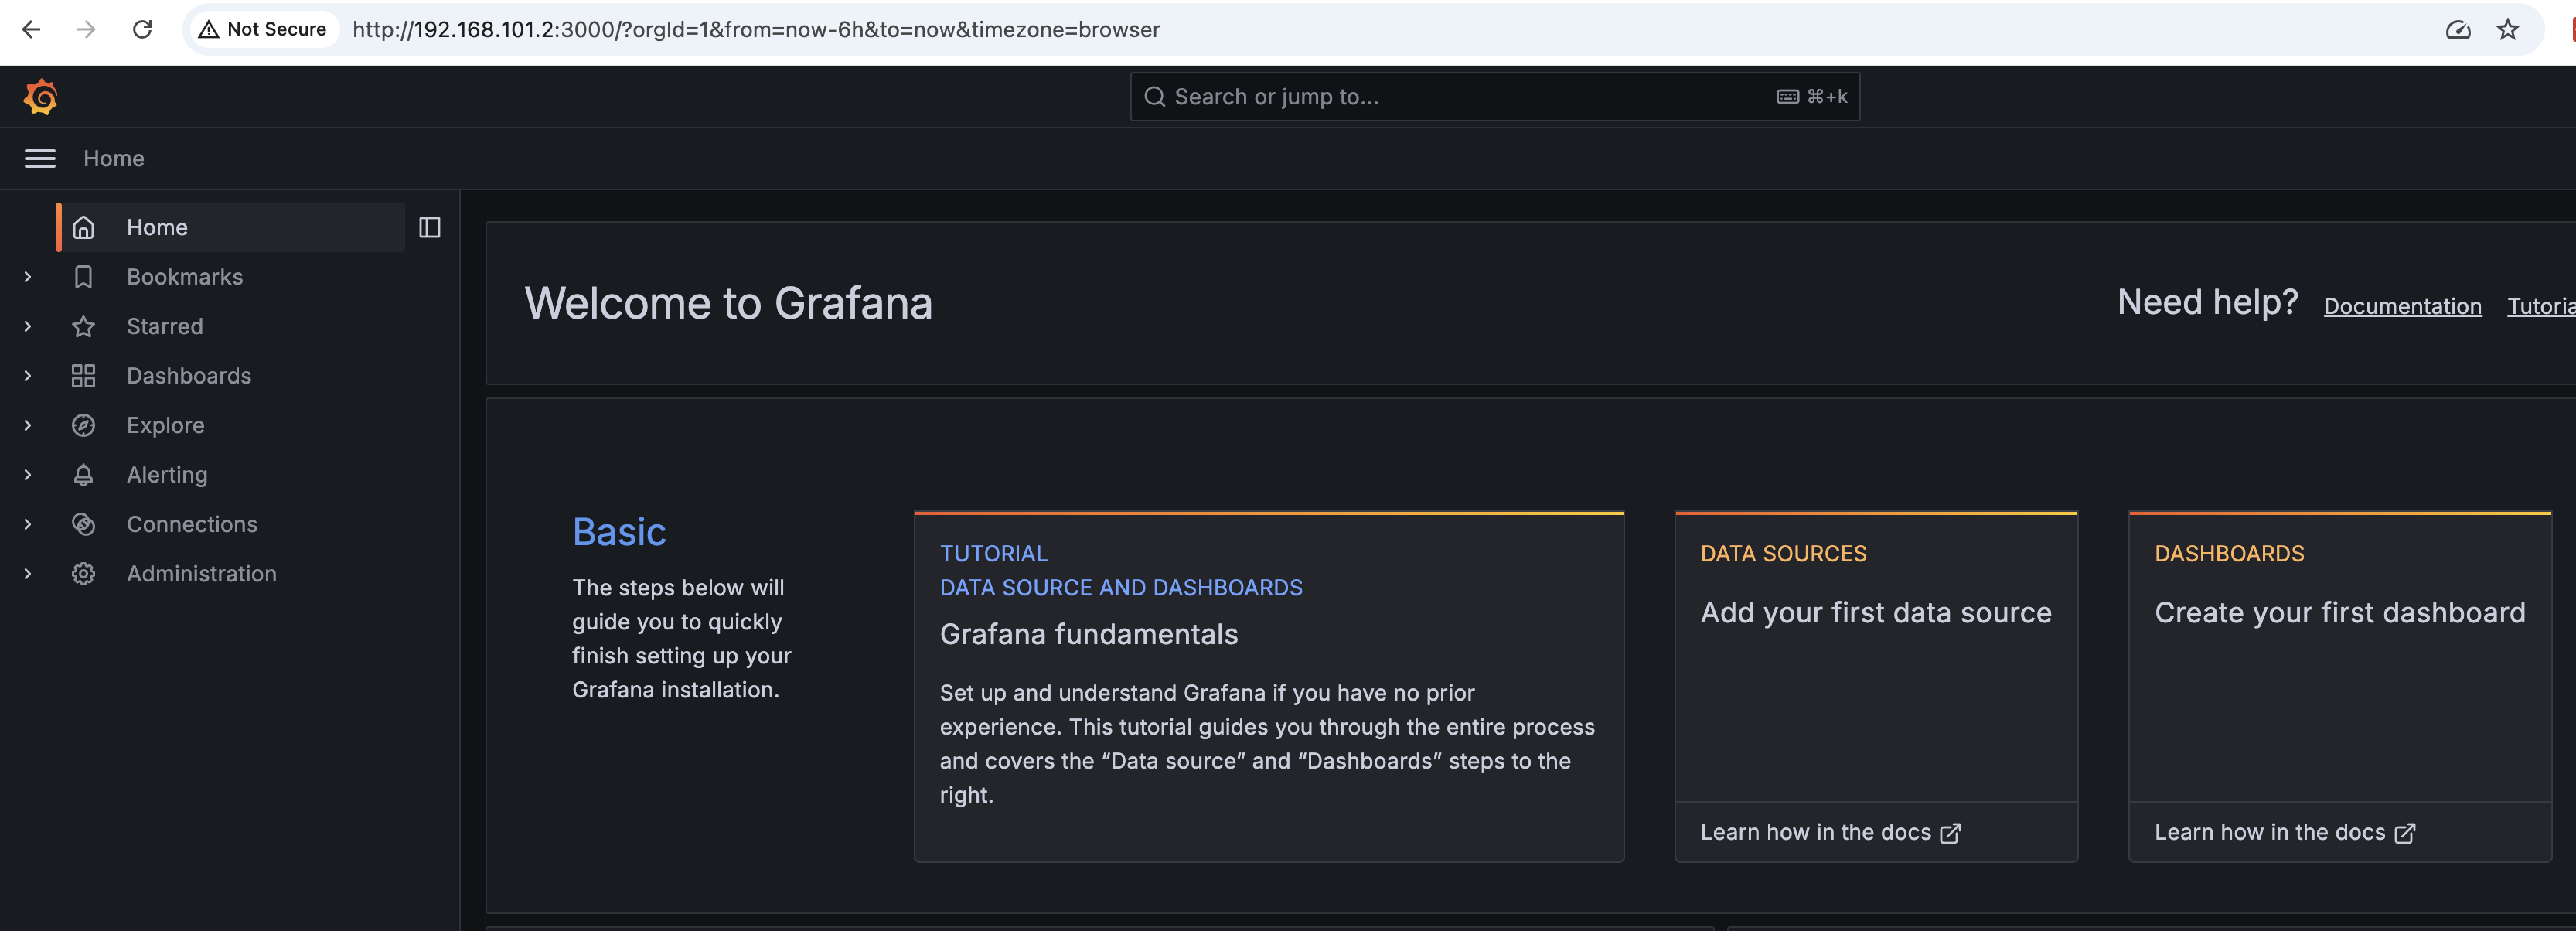
Now that we have data flowing into InfluxDB, let's visualize it in Grafana! First, we'll connect Grafana to our InfluxDB data source.
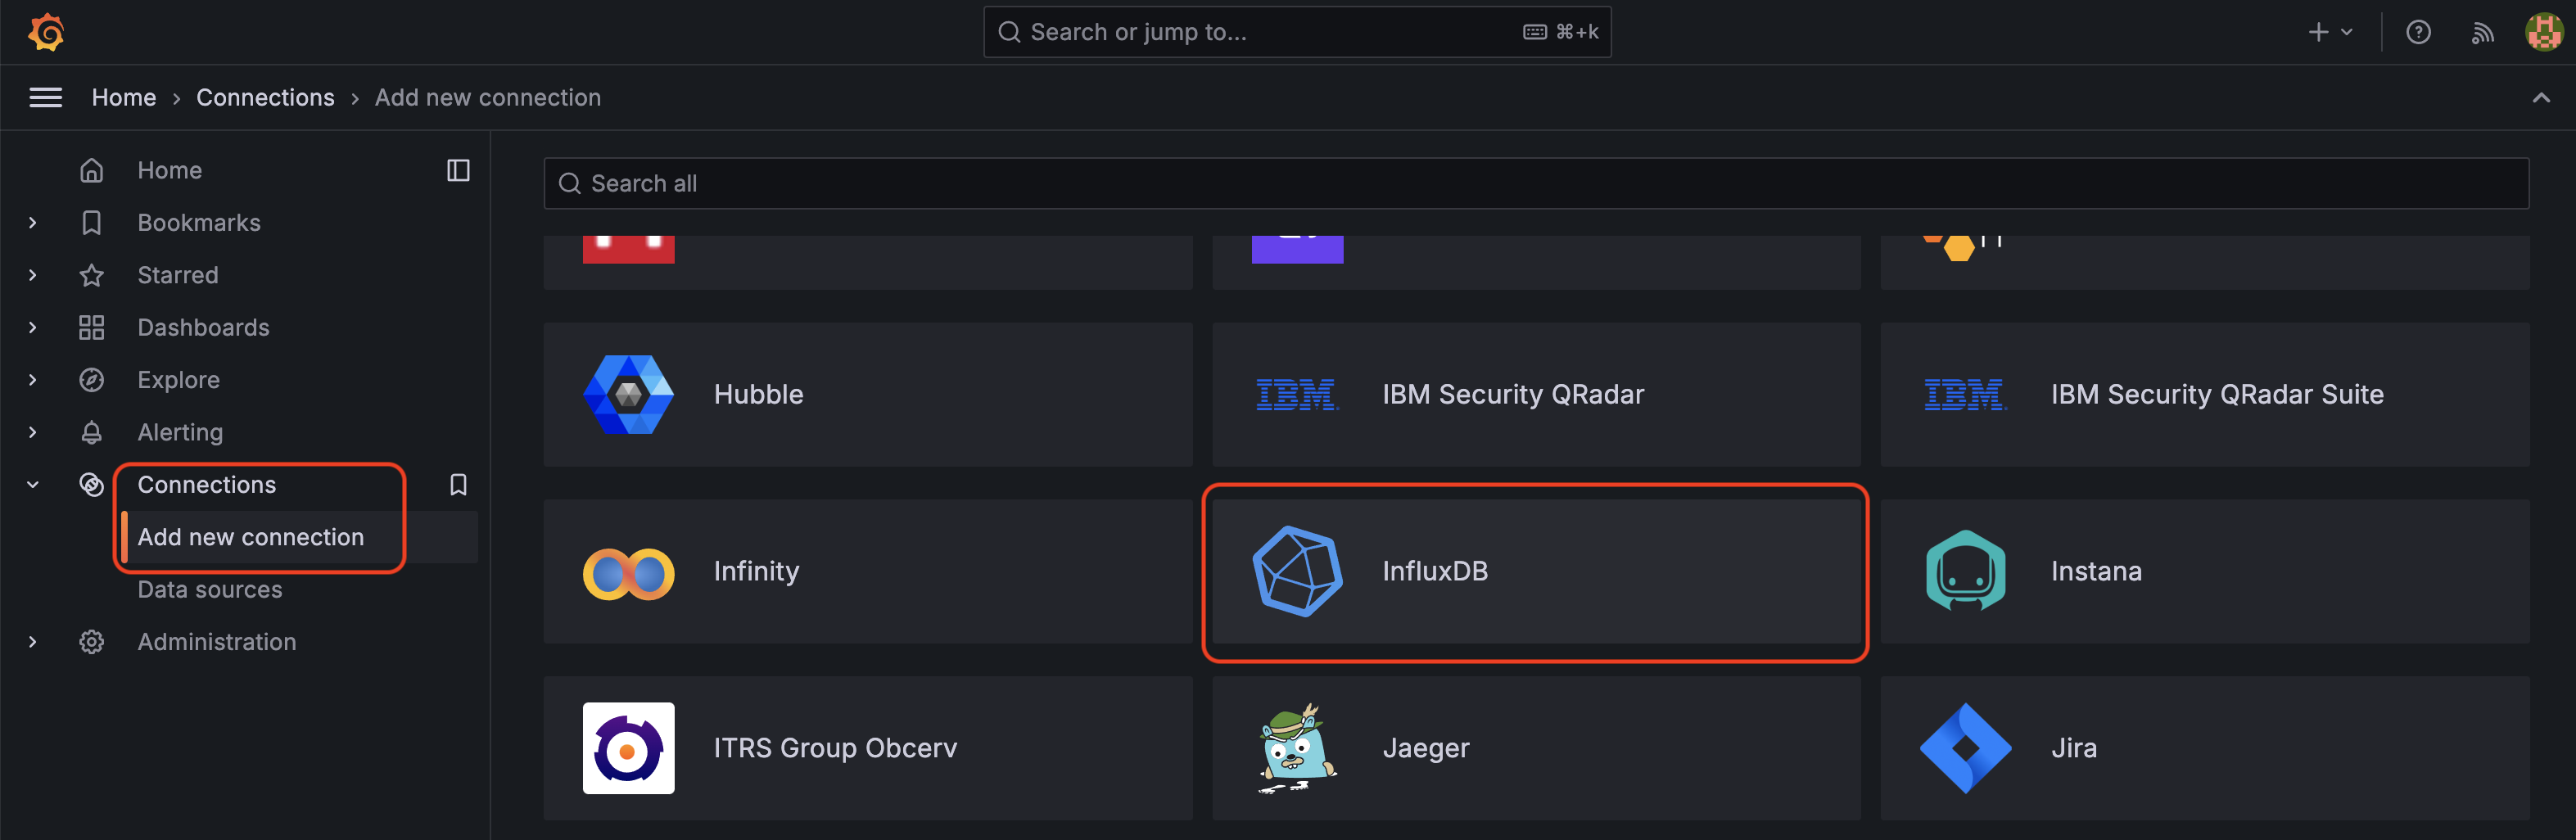
- Click Connections in the left-side menu
- Click Add new connection
- Search for
InfluxDBand select it
-
Click Add new data source
-
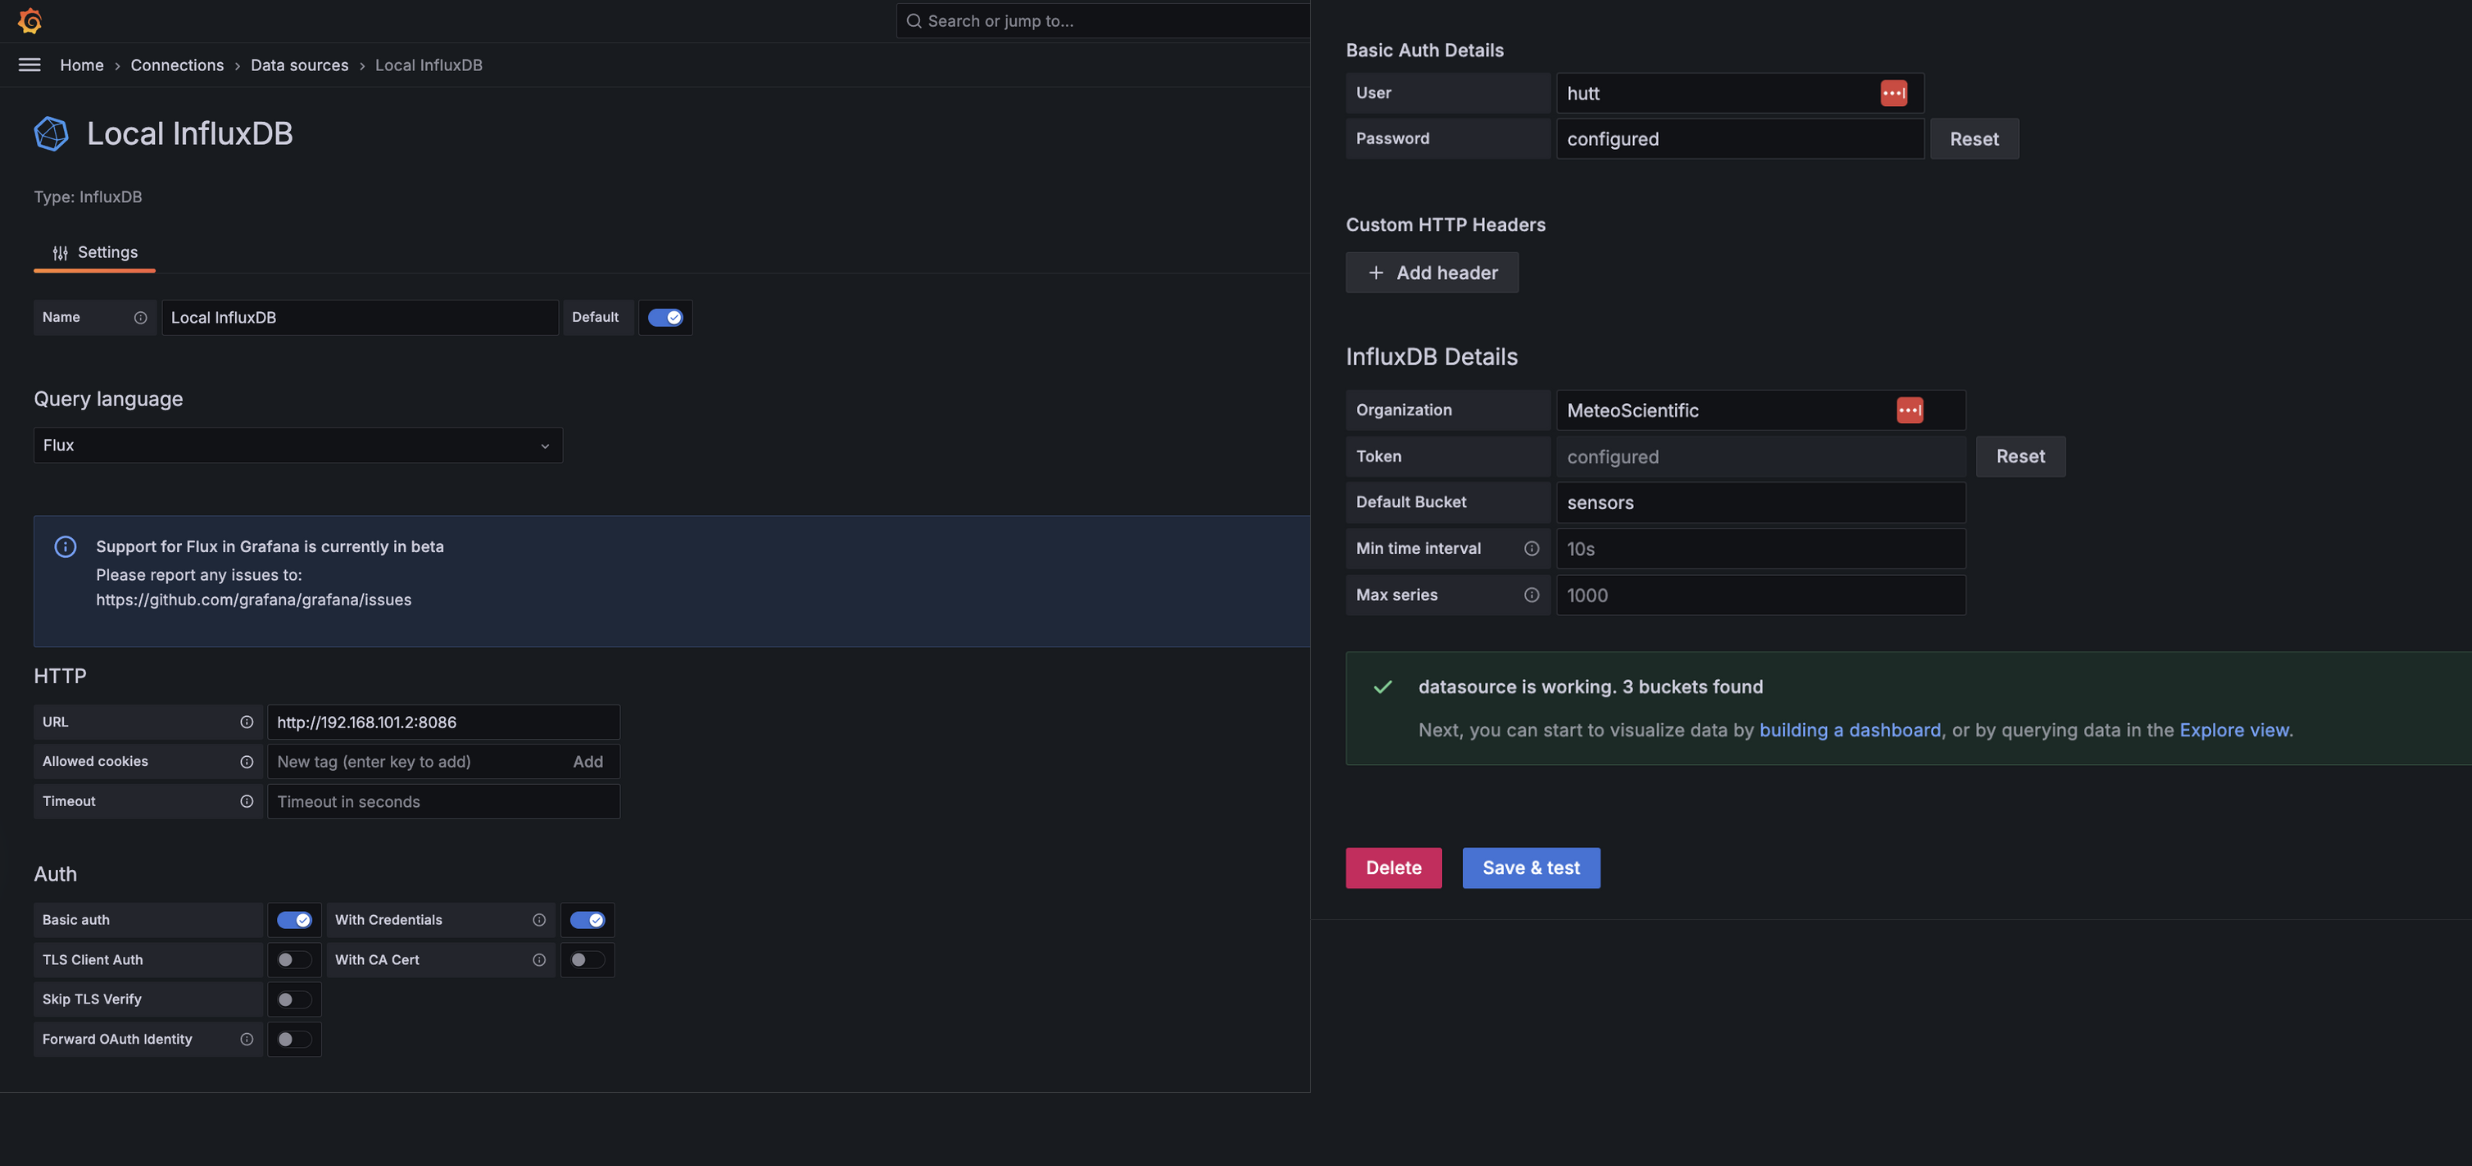
Configure the following settings, leaving everything else as is:
Basic Settings:
- Name:
Local InfluxDB - Default: ✓ (checked)
Query Language:
- Select:
Flux(You'll see a note that Flux support is in beta - that's okay!)
HTTP Settings:
- URL:
http://<YOUR-PI-IP>:8086
Auth:
- Basic auth: Toggle ON
- With Credentials: Toggle ON
- User: [your InfluxDB username]
- Password: [your InfluxDB password]
InfluxDB Details:
- Organization: [your org name from credentials file]
- Token: [paste your token from credentials file]
- Default Bucket:
sensors - Min time interval:
10s - Max series:
1000
- Name:
-
Click Save & test at the bottom You should see "Data source is working" if everything is configured correctly
Now let's create a dashboard to visualize our LDDS75 data.
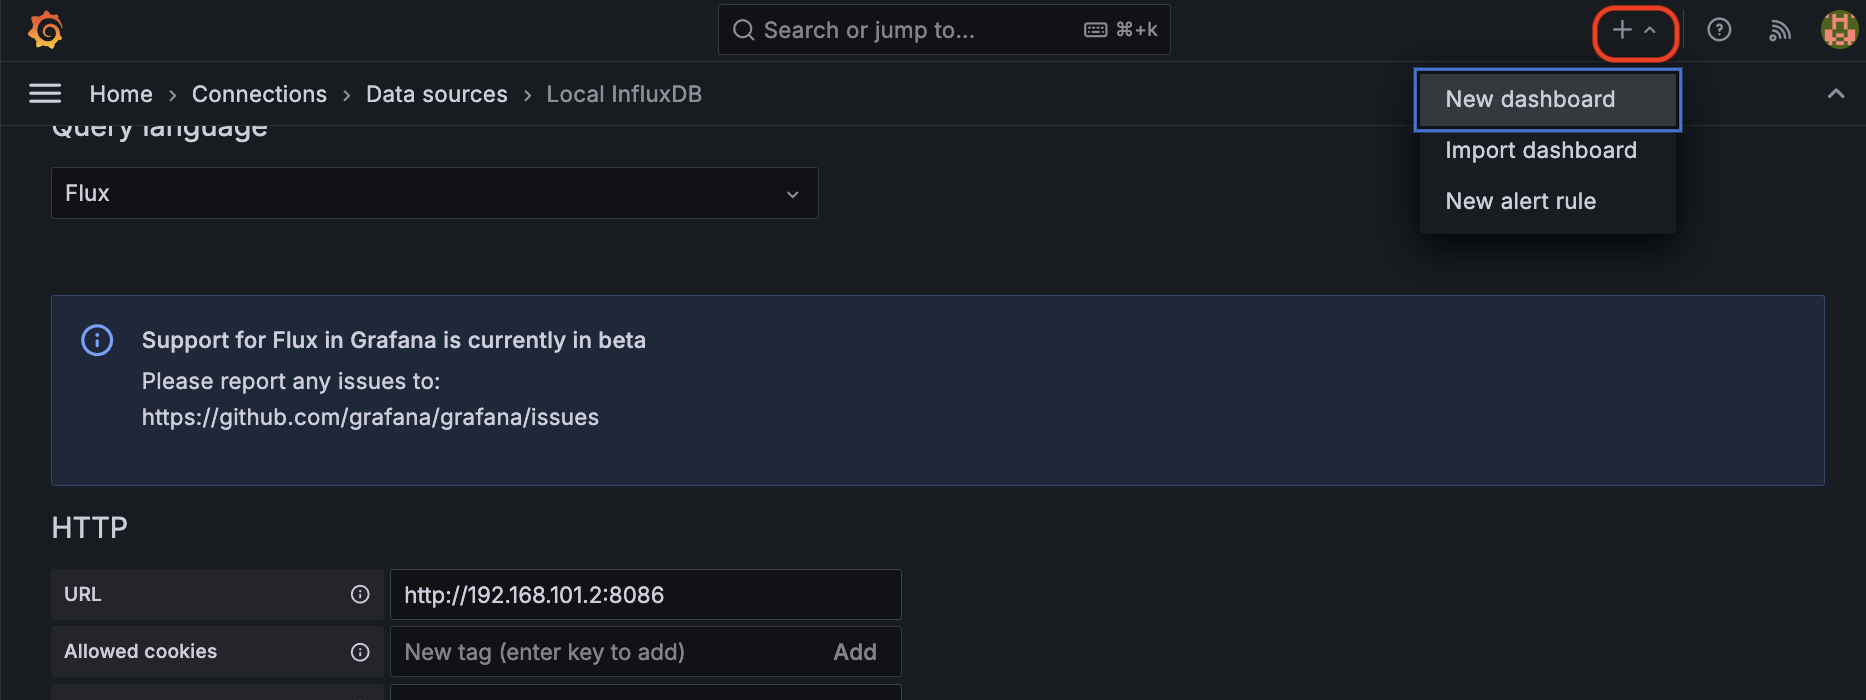
- Click the + icon up at the top right
- Select New Dashboard
- Click Add visualization
- Select your
Local InfluxDBdata source - In the Flux Query editor, paste the following, making sure you replace
LDDS 3with your own device name:
from(bucket: "sensors")
  |> range(start: -4h)
  |> filter(fn: (r) => r["_measurement"] == "ldds75_metsci")
  |> filter(fn: (r) => r["device"] == "LDDS 3")
  |> filter(fn: (r) => r["_field"] == "distance")
  |> keep(columns: ["_time", "_value", "device"])
  |> last()
  |> yield(name: "distance")
Now, over on the right, we're going to configure the visualization settings.
The type of visualization we're going to use is a Time Series graph. This is ideal for showing changes over time.
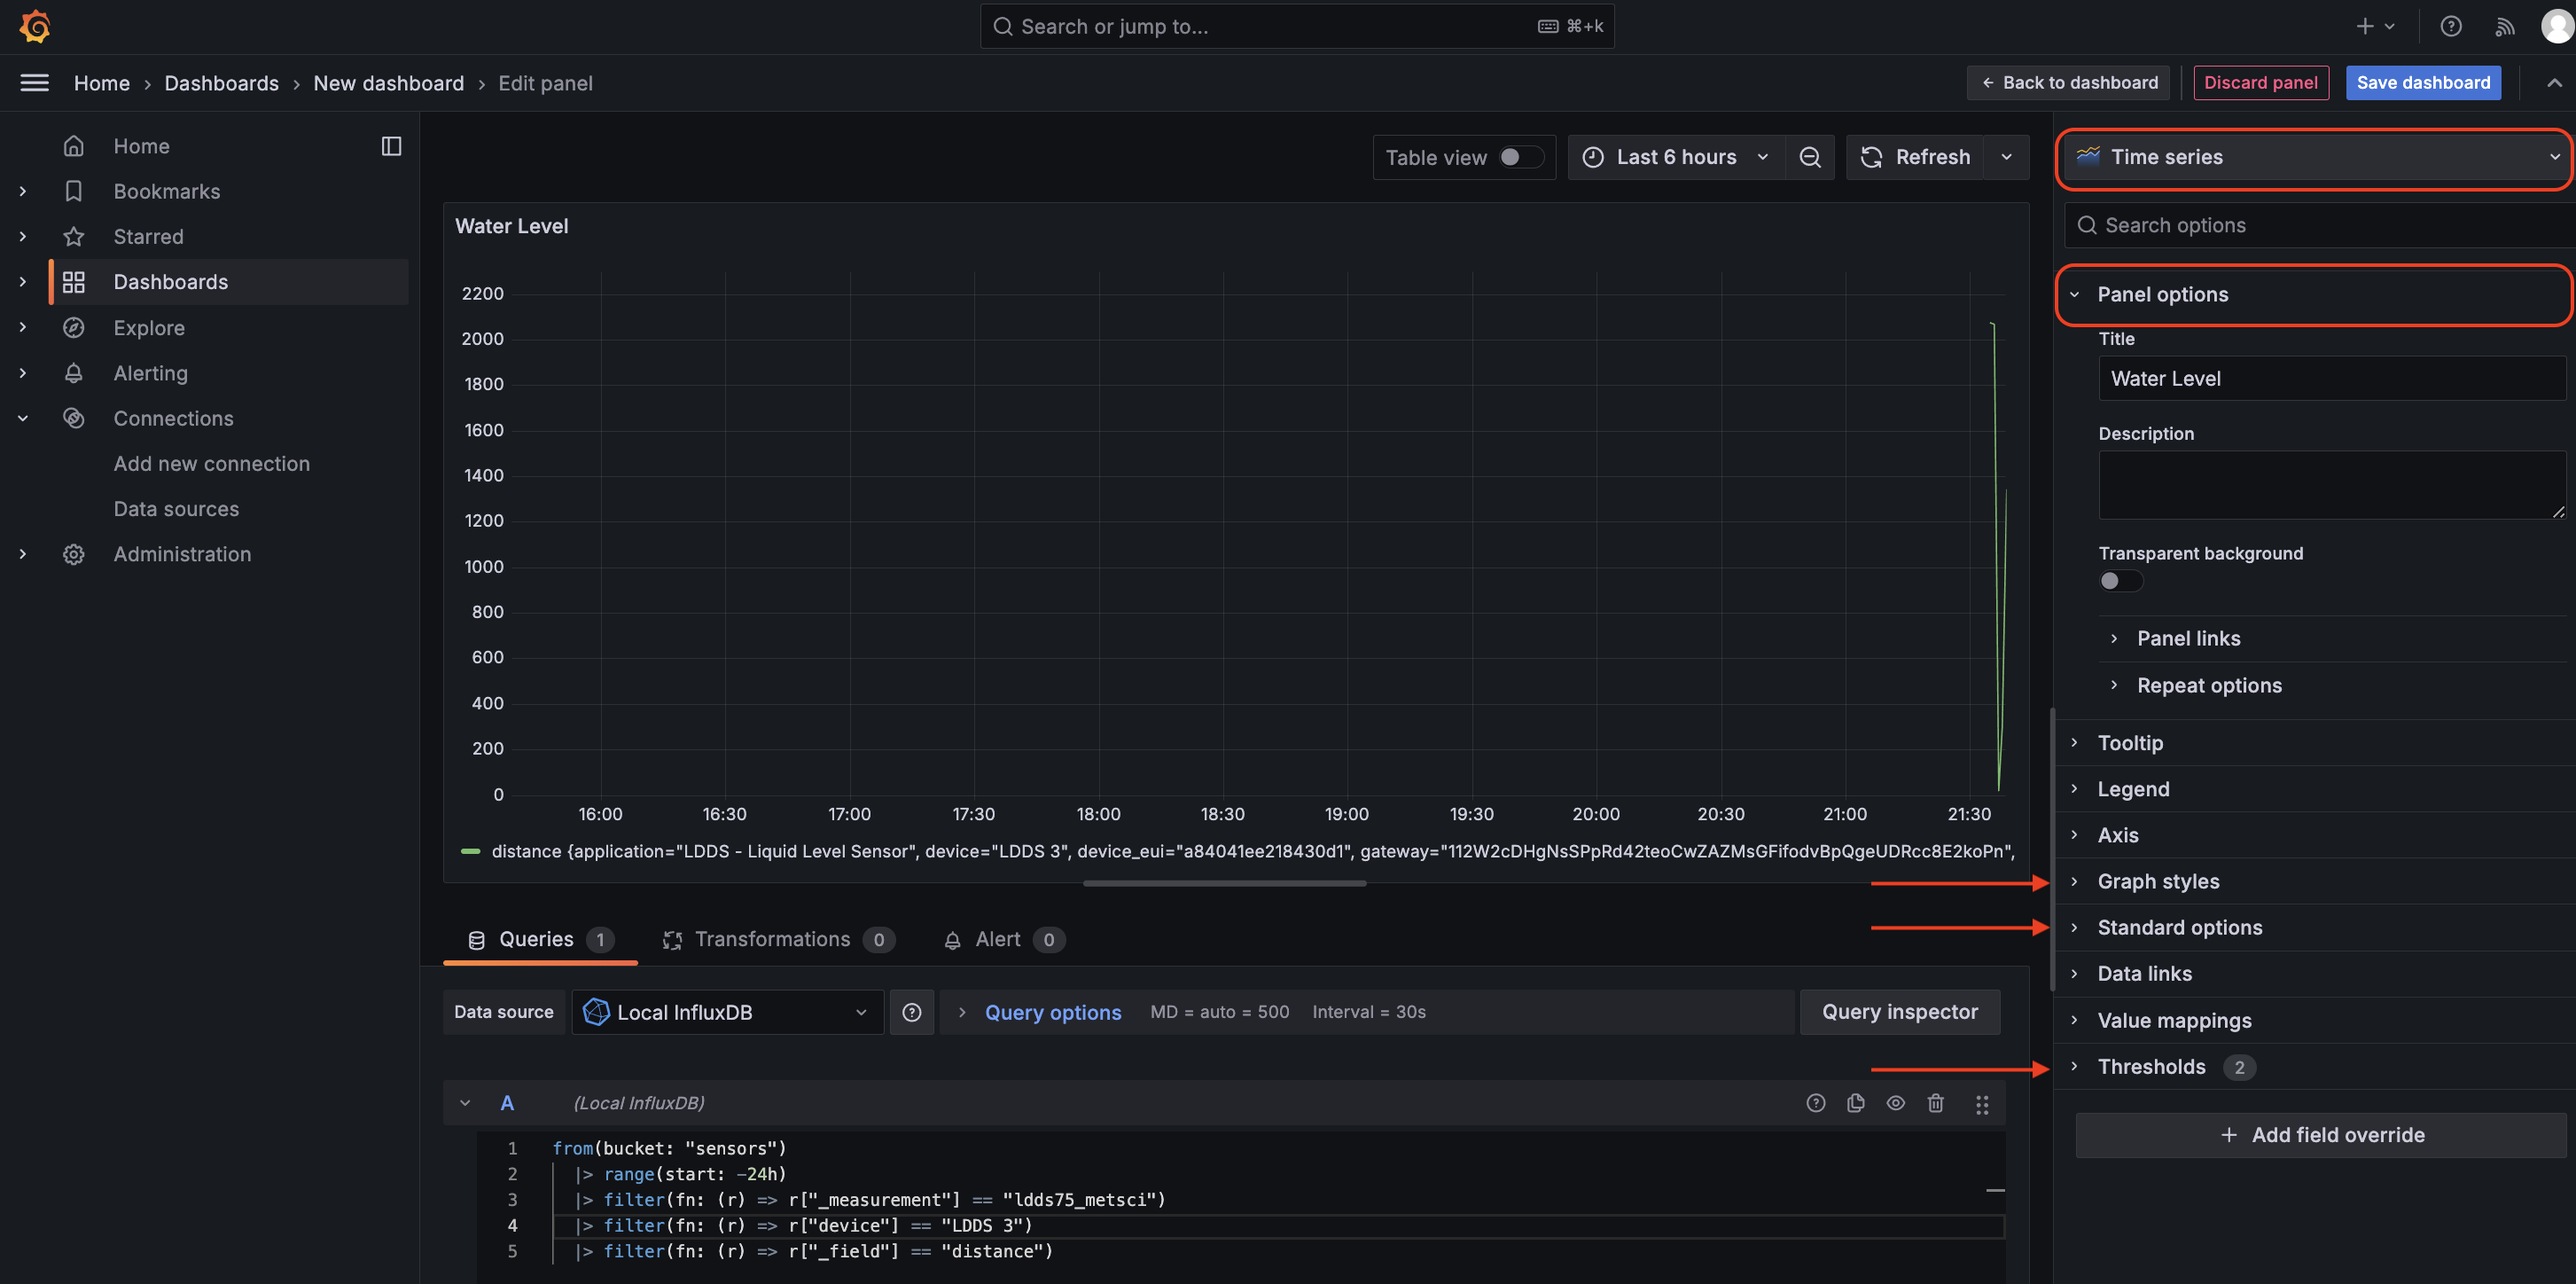
At the top right, select Time series.
-
Panel Options- Title: "Water Level"
- Description: "Current distance to liquid surface"
-
Value Options- Calculate: "Last *"
- Fields: Select "Numeric Fields" only
-
Standard Options- Unit: Distance → millimeters (mm)
- Min: 0
- Max: 8500 (this is the max, adjust based on your tank size)
- Decimals: 0 (millimeters don't need decimals)
-
Thresholds- Add threshold at 80% of your maximum expected water level
- Base color: Green
- Above 80%: Red (indicates barrel is getting full)
-
Save your dashboard, then leave the edit window and go
Back to dashboard.
The keep(columns: ["_time", "_value", "device"]) in the query is crucial - it prevents duplicate gauges by stripping unnecessary tags while maintaining the essential data for display.
Now let's do a little admin work, then set up the sharing aspect. Grafana makes this dead easy.
First, in your Pi Terminal:
sudo nano /etc/grafana/grafana.ini
You'll see the full file, modify/add the following, replacing the domain and subdomain with your own as appropriate:
[server]
domain = grafana.gristleking.dev
root_url = https://grafana.gristleking.dev

[security]
allow_embedding = true
Save & close with Ctrl+X, then Y, then Enter.
Now restart Grafana:
sudo systemctl restart grafana-server
Back in Grafana, Save your dashboard, refresh the page, then Exit Edit
Click the Share button in the top right. Go to the Public Dashboard tab
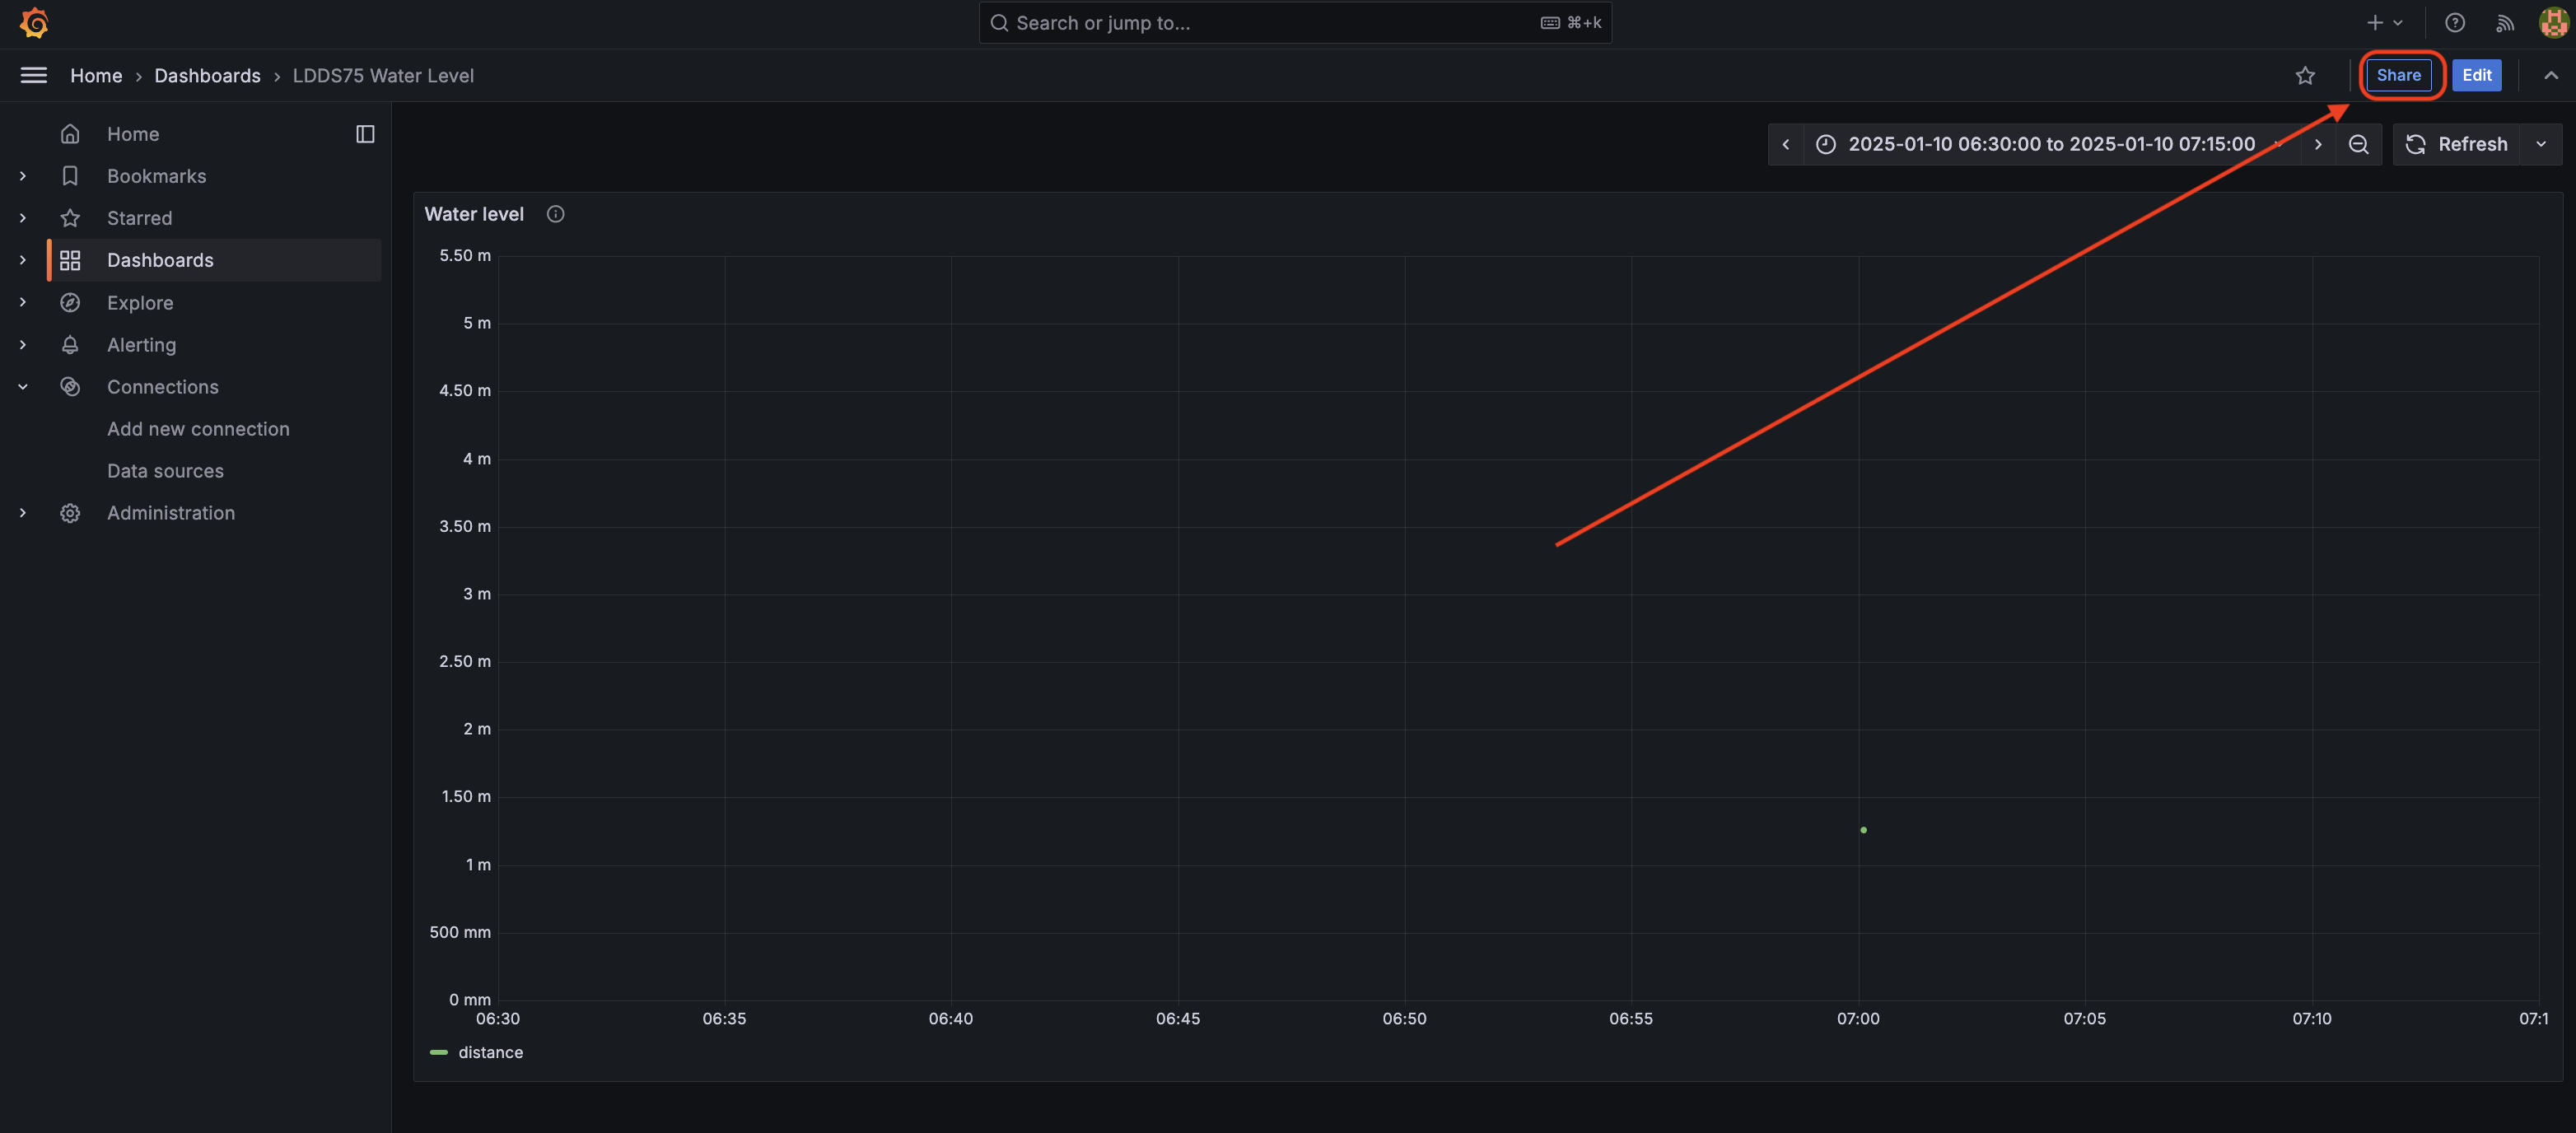
Check all the boxes, then click Generate Public URL. It should generate a URL like https://grafana.<YOUR-DOMAIN>>.dev/d/000000002/ldds75-metsci-dashboard?orgId=1&var-device=LDDS%202.
Copy the URL and paste it into your browser, or share it with your Mom. Now everybody can see how much water is in your tank. Bam, you're public!
D. Fun with Monitoring & Triggers
We're now finished with the bulk of this tutorial. You've got a dashboard, you've got data flowing into InfluxDB, and you've got a way to share it with the world. From here, you can add more sensors, build more complex dashboards, or string together new Node-RED flows to trigger alerts or other actions. Following are a few examples of what you could do next.
1. Indoor Environment Monitoring
Liquid level sensing is simple, but generally not that exciting, so...
Using the steps above, I've added in a Milesight AM319, including an Applicaton and Policy in Cloudflare and a second dashboard. This is what it looks like with some live data:
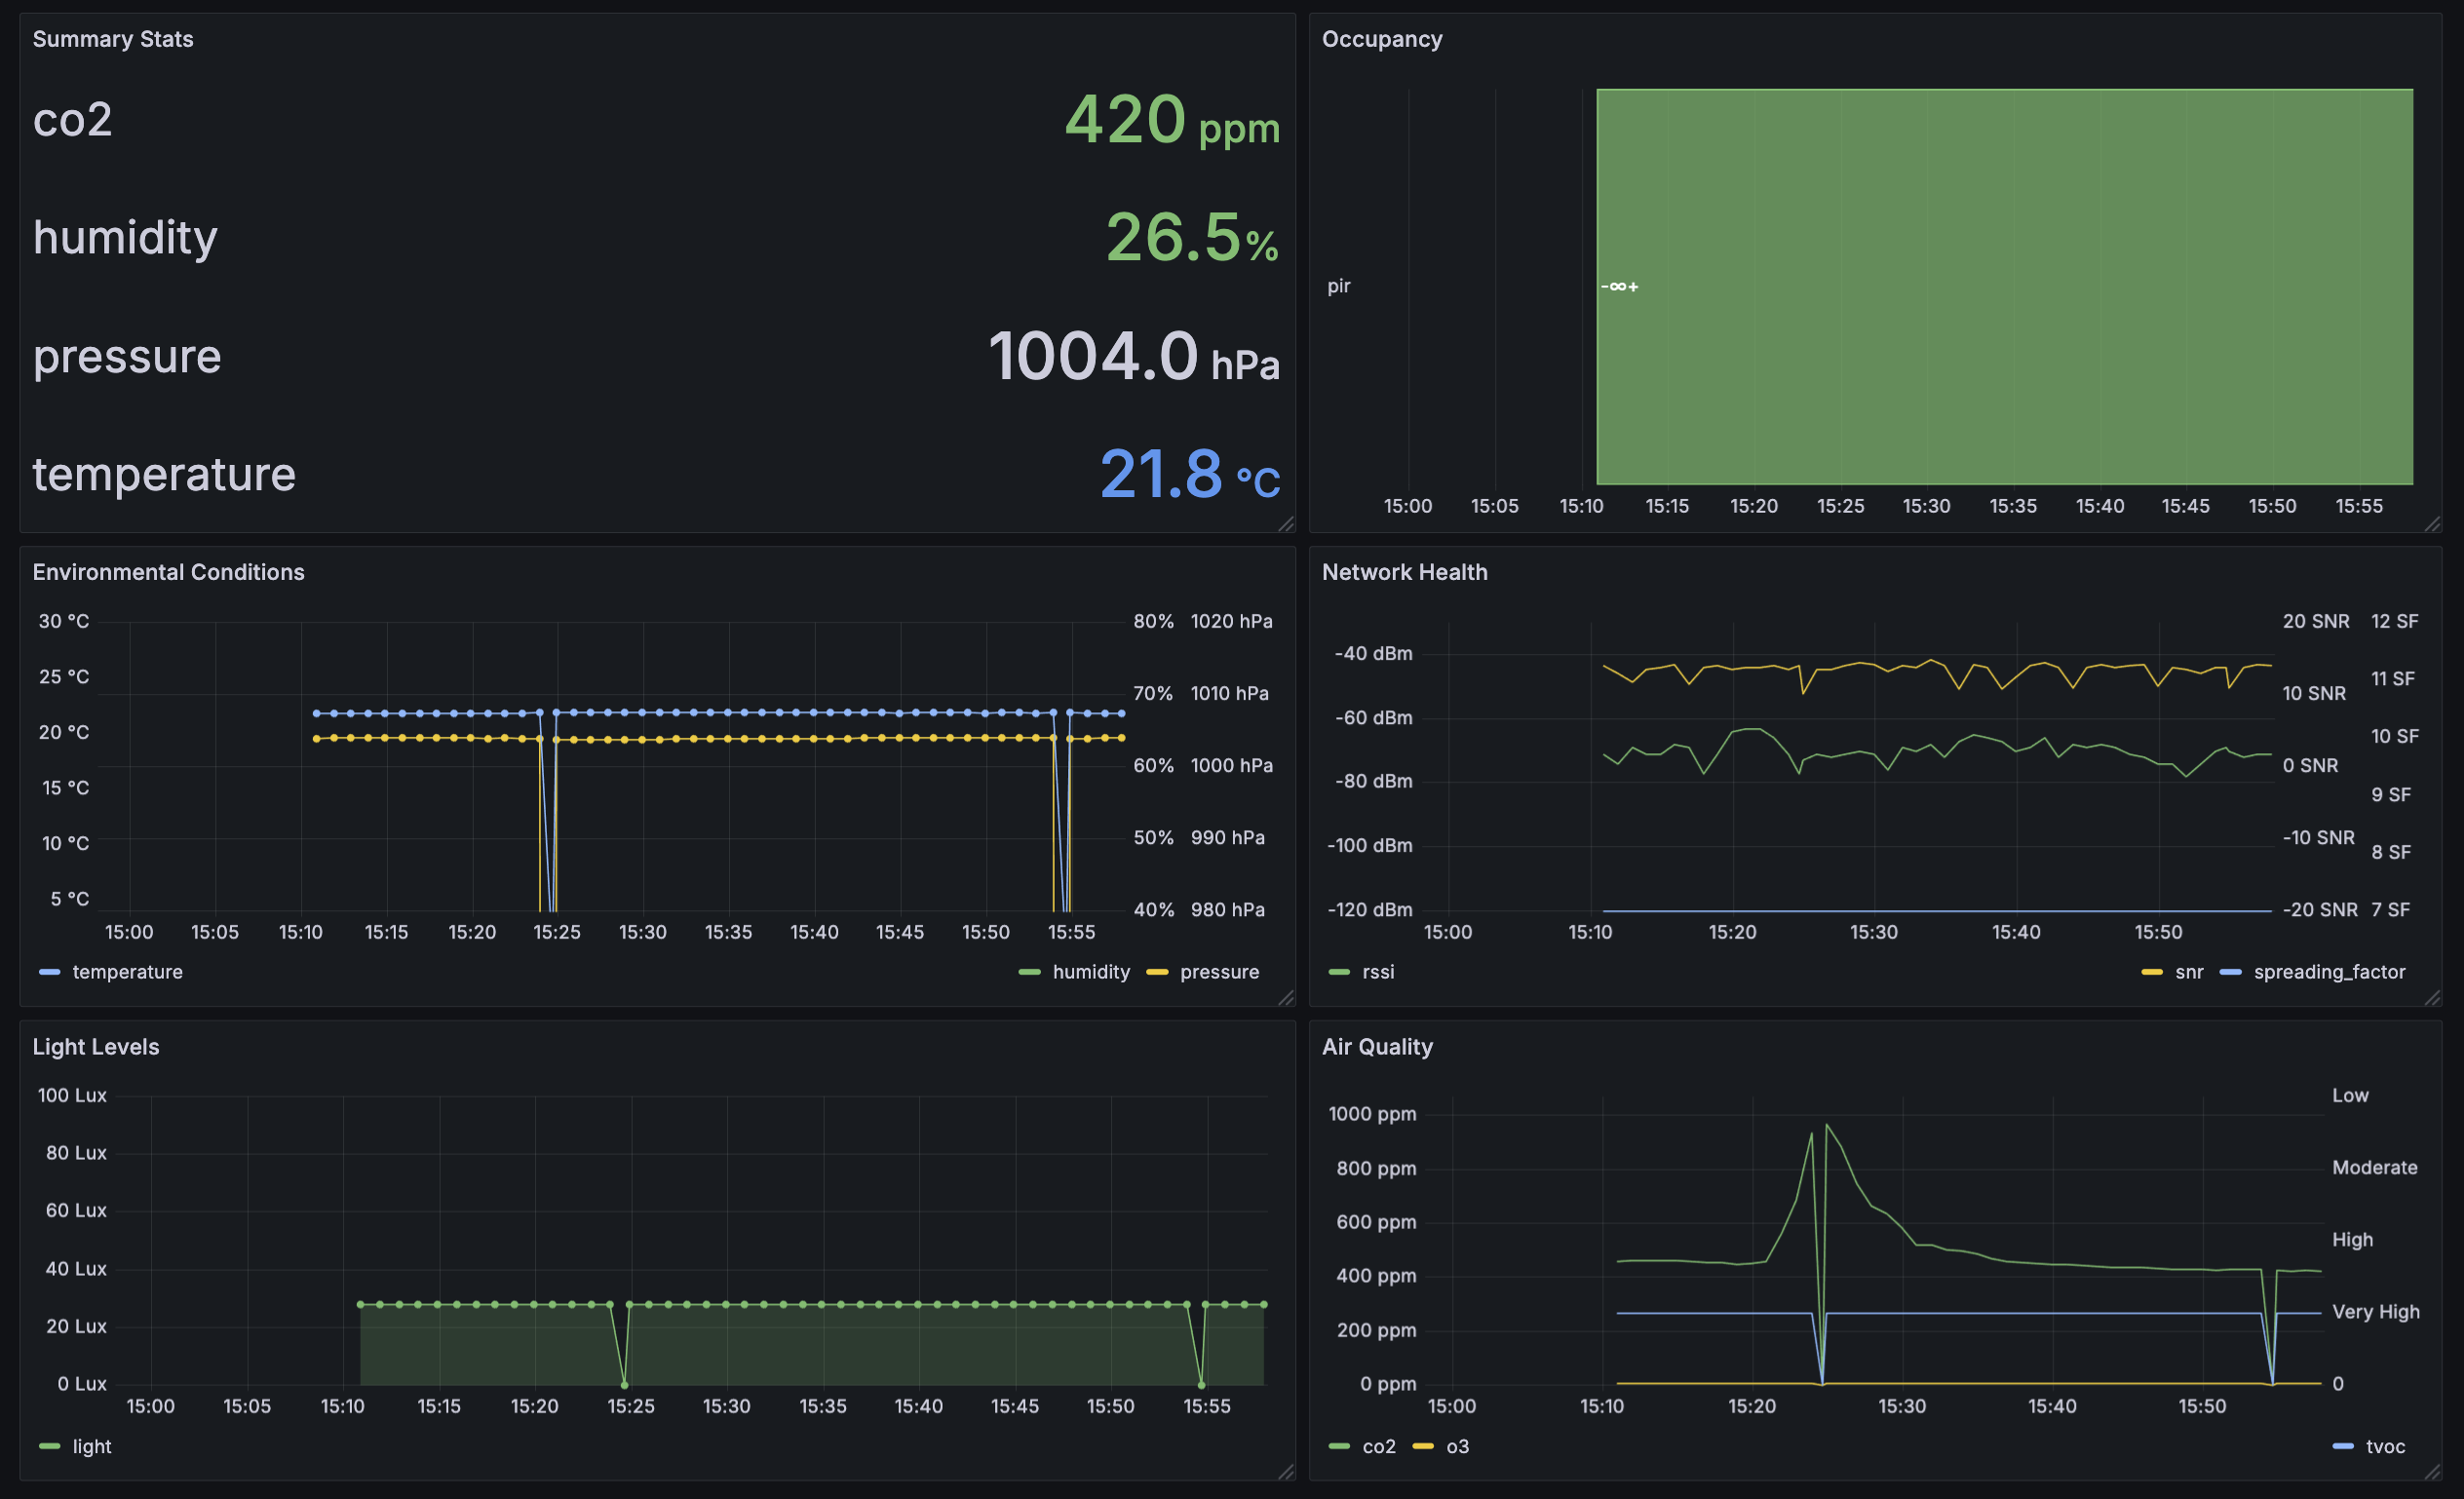
Just so you could see some real change,I closed up all the windows & doors in my office and did burpees until the CO2 went up. You can also see where we dropped a couple of packets. The AM319 fires a huge packet every minute, so it's easy to see where the packets are dropped.
Want to skip the manual setup? You can download the complete LDDS75 flow here and import it directly into Node-RED.
After downloading:
- Configure your InfluxDB credentials
- Update any device-specific information
- Deploy the flow after importing
2. Home Assistant Integration
If you're using Home Assistant you can use Node-RED on the Pi to pipe in data from the dashboard you just set up to Home Assistant.
Installing and configuring HA is well beyond the scope of this tutorial, but for those of you who already have it running and want to pipe in data from your shiny new MetSci setup, here's how you can do it:
-
Install the Home Assistant nodes in Node-RED on your MetSci Pi:
cd ~/.node-red
npm install node-red-contrib-home-assistant-websocket -
In Node-RED, add and configure the
home-assistantconfig node:- Protocol:
httporhttps(depending on your HA setup) - Base URL:
http://YOUR_HA_IP:8123(or your external URL) - Access Token: Create a Long-Lived Access Token in HA (HA Profile → Long-Lived Access Tokens → Create Token)
- Protocol:
-
Add a
call-servicenode after your LDDS75 Function node:Domain: sensor
Service: set_state
Entity ID: sensor.water_level
Data: {
state: msg.payload[0].distance,
attributes: {
unit_of_measurement: "mm",
friendly_name: "Water Level",
device_class: "distance",
battery_level: msg.payload[0].battery
}
} -
Restart Home Assistant to apply changes
When connecting services across devices:
- Use strong, unique passwords and tokens
- Consider setting up a VPN if accessing over the internet
- Use SSL/TLS when possible
- Limit firewall rules to specific IPs
- Monitor logs for unauthorized access attempts
Example Lovelace Card Add this to your Lovelace dashboard in Home Assistant:
type: vertical-stack
cards:
  - type: gauge
    name: Water Level
    entity: sensor.water_level
    min: 0
    max: 2500
    severity:
      green: 0
      yellow: 800
      red: 100
  - type: history-graph
    title: Water Level History
    entities:
      - entity: sensor.water_level
        name: Level
3. Class C Integration
I've talked about how to use Class C in the MetSci Class C via API tutorial. You could use that, or you can use Node-RED to pipe data from the LDDS75 to your Class C device, in my case, a Kuando Busylight.
Since you've already set up Node-RED, I'll just share the flow I built for mine.
It'll look like this:
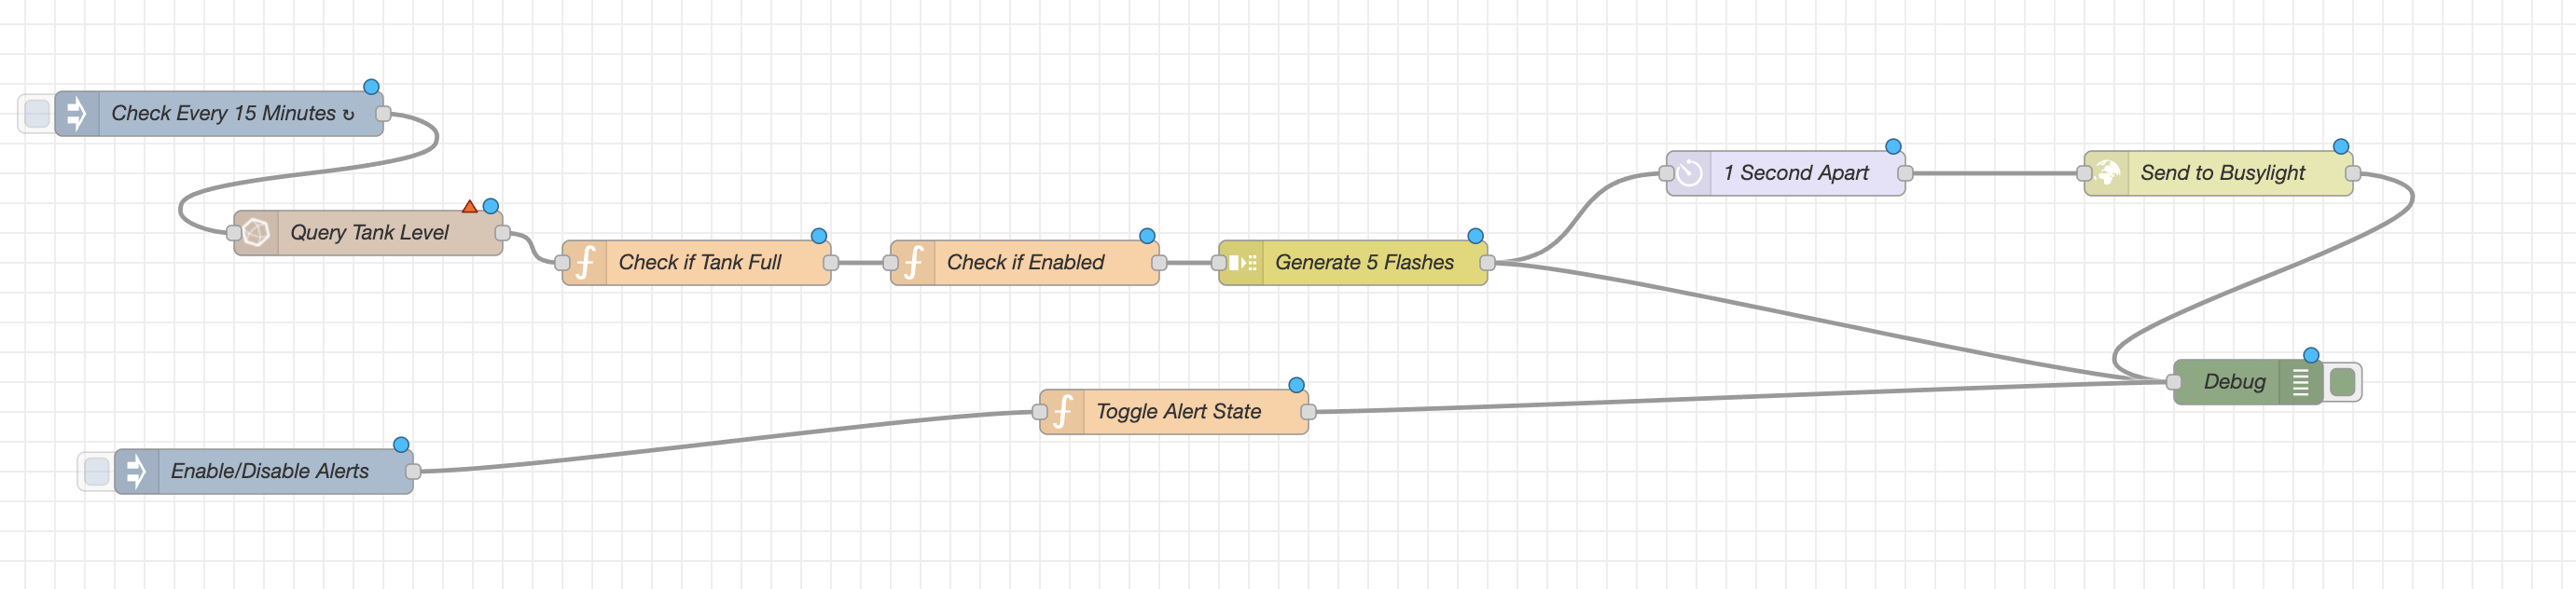
Setting that up will check the LDDS75 distance measurements in the InfluxDB every 15 minutes, then flash your Busylight red 5 times on a 1 second interval every 15 minutes when the tank is full (distance of 120mm or less) until you turn the Node-RED alert off or the tank is no longer full.
Let your imagination run wild! You could also use this to trigger other actions, like sending an email, triggering a Home Assistant automation, or even triggering a Class C device to send a message:
Airstrikes required on unknown vehicle parked in "MY" parking spot
Just kidding, airstrikes triggered by a LoRaWAN device are for war, not parking violations. But...we're American, so maybe we can make an execption. 😉
7. System Maintenance & Troubleshooting
A. Credentials Management
Your credentials are stored in several locations:
- Node-RED:
~/.node-red/settings.js - InfluxDB:
/var/lib/influxdb/influxd.bolt(and/var/lib/influxdb/engine/) - Grafana:
/etc/grafana/grafana.ini - Installation credentials: Generated in
~/metsci-credentials.txt
After setting up your services, securely store the contents of ~/metsci-credentials.txt somewhere safe, then delete it from your Pi:
rm ~/metsci-credentials.txt
B. Backing Up Configurations
Create a backup script for your configurations:
#!/bin/bash
BACKUP_DIR="/mnt/ssd/backups/$(date +%Y%m%d)"
mkdir -p $BACKUP_DIR

# Backup Node-RED flows and settings
cp -r ~/.node-red/* $BACKUP_DIR/node-red/

# Backup service configs
sudo cp -r /var/lib/influxdb $BACKUP_DIR/influxdb/
sudo cp /etc/grafana/grafana.ini $BACKUP_DIR/

# Set permissions
sudo chown -R $USER:$USER $BACKUP_DIR
C. System Updates
Regular maintenance tasks:
# Update system packages
sudo apt update && sudo apt upgrade -y

# Restart services after updates
sudo systemctl restart nodered influxdb grafana-server
D. Troubleshooting Guide
1. Service Not Starting
Check service status:
sudo systemctl status [service-name] # nodered, influxdb, or grafana-server
View logs:
sudo journalctl -u [service-name] -n 50 --no-pager
2. Lost Connection to Pi
- Check if Pi is powered on
- Verify network connection
- Try direct connection via ethernet
- Check Cloudflare tunnel status:
sudo systemctl status cloudflared
3. Data Not Flowing
Check each step:
- MetSci LNS → View device events in console
- Cloudflare → Check tunnel logs
- Node-RED → Check debug tab
- InfluxDB → Test token and query recent data:
# Test token
curl -v "http://localhost:8086/api/v2/write?org=YOUR_ORG&bucket=sensors" \
  -H "Authorization: Token YOUR_TOKEN" \
-d "test,host=test value=1" - Grafana → Check data source connection
4. Disk Space Issues
Monitor disk usage:
df -h
```Check service logs taking up space:
```bash
sudo du -h /var/log | sort -rh | head -n 10
If something goes wrong:
- Check the relevant service status
- Review the logs
- Restore from backup if needed
- If nothing else works, you can always reinstall the affected service
8. La Ultima
Last step? Here's the dashbboard I built for MeteoScientific, combining the rain barrel data with weather station data.
I'd love to see what you do! Please tag us on X MeteoScientific and Gristleking we'd love to see what you've done!
This tutorial was made possible by a generous grant from the Helium Foundation's IOTWG; huge thanks to them for the support.